

वास्तविक पैटर्न

पैटर्न ग्राफिकल मॉडल हैं जो चार्ट में मूल्य से बने होते हैं। तकनीकी विश्लेषण भविष्यवाणियों में से एक के अनुसार, इतिहास का मतलब मूल्य आंदोलन खुद को दोहराता है। इसका मतलब है कि मूल्य आंदोलन अक्सर एक ही परिस्थितियों में समान होते हैं जो उच्च संभावना के साथ स्थिति के आगे के विकास की भविष्यवाणी करना संभव बनाता है।
इंस्टा फॉरेक्स द्वारा प्रासंगिक पैटर्न एक उपयोग में आसान सेवा है जो आपको बाजार में नवीनतम परिवर्तनों के बारे में जागरूक होने और समय पर बाजार से संकेतों पर प्रतिक्रिया करने की अनुमति देती है। हमारी सेवा में आप हमेशा किसी भी जोड़ी और किसी भी समय सीमा पर नवीनतम और सबसे प्रासंगिक पैटर्न प्राप्त कर सकते हैं.
Bearish pennant
was formed on 20.03 at 07:10:03 (UTC+0)
signal strength 4 of 5
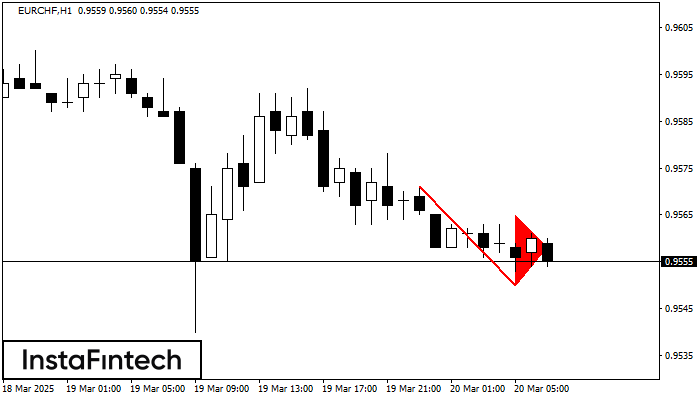
The Bearish pennant pattern has formed on the EURCHF H1 chart. It signals potential continuation of the existing trend. Specifications: the pattern’s bottom has the coordinate of 0.9550; the projection of the flagpole height is equal to 21 pips. In case the price breaks out the pattern’s bottom of 0.9550, the downtrend is expected to continue for further level 0.9510.
- All
- All
- Bearish Rectangle
- Bearish Symmetrical Triangle
- Bearish Symmetrical Triangle
- Bullish Rectangle
- Double Top
- Double Top
- Triple Bottom
- Triple Bottom
- Triple Top
- Triple Top
- All
- All
- Buy
- Sale
- All
- 1
- 2
- 3
- 4
- 5
डबल बॉटम
was formed on 22.03 at 17:34:47 (UTC+0)
signal strength 1 of 5

डबल बॉटम पैटर्न #Bitcoin M5 पर बना है। विशेषताएं: समर्थन स्तर 83931.70; प्रतिरोध स्तर 84051.13; पैटर्न की चौड़ाई 11943 पॉइंट्स। यदि प्रतिरोध स्तर टूट जाता है, तो रुझान में बदलाव
M5 और M15 समय सीमा में अधिक फाल्स एंट्री पॉइंट्स हो सकते हैं।
Open chart in a new window
बुलिश सिमेट्रिकल त्रिभुज
was formed on 21.03 at 22:40:31 (UTC+0)
signal strength 1 of 5

M5 के चार्ट के अनुसार, AUDUSD से बुलिश सिमेट्रिकल त्रिभुज पैटर्न बना। विवरण: यह एक ट्रेंड जारी रहने का पैटर्न है। 0.6279 और 0.6267 क्रमशः ऊपरी और निचली सीमाओं के
M5 और M15 समय सीमा में अधिक फाल्स एंट्री पॉइंट्स हो सकते हैं।
Open chart in a new window
बुलिश सिमेट्रिकल त्रिभुज
was formed on 21.03 at 22:36:29 (UTC+0)
signal strength 1 of 5

M5 के चार्ट के अनुसार, USDCHF से बुलिश सिमेट्रिकल त्रिभुज पैटर्न बना। पैटर्न की निचली सीमा ने निर्देशांक 0.8825/0.8830 को स्पर्श किया जबकि ऊपरी सीमा 0.8835/0.8830 के पार गई। यदि
M5 और M15 समय सीमा में अधिक फाल्स एंट्री पॉइंट्स हो सकते हैं।
Open chart in a new window


