

वास्तविक पैटर्न

पैटर्न ग्राफिकल मॉडल हैं जो चार्ट में मूल्य से बने होते हैं। तकनीकी विश्लेषण भविष्यवाणियों में से एक के अनुसार, इतिहास का मतलब मूल्य आंदोलन खुद को दोहराता है। इसका मतलब है कि मूल्य आंदोलन अक्सर एक ही परिस्थितियों में समान होते हैं जो उच्च संभावना के साथ स्थिति के आगे के विकास की भविष्यवाणी करना संभव बनाता है।
इंस्टा फॉरेक्स द्वारा प्रासंगिक पैटर्न एक उपयोग में आसान सेवा है जो आपको बाजार में नवीनतम परिवर्तनों के बारे में जागरूक होने और समय पर बाजार से संकेतों पर प्रतिक्रिया करने की अनुमति देती है। हमारी सेवा में आप हमेशा किसी भी जोड़ी और किसी भी समय सीमा पर नवीनतम और सबसे प्रासंगिक पैटर्न प्राप्त कर सकते हैं.
Double Bottom
was formed on 22.03 at 17:34:47 (UTC+0)
signal strength 1 of 5

The Double Bottom pattern has been formed on #Bitcoin M5. Characteristics: the support level 83931.70; the resistance level 84051.13; the width of the pattern 11943 points. If the resistance level is broken, a change in the trend can be predicted with the first target point lying at the distance of 10667 points.
The M5 and M15 time frames may have more false entry points.
See Also
- All
- All
- Bearish Rectangle
- Bearish Symmetrical Triangle
- Bearish Symmetrical Triangle
- Bullish Rectangle
- Double Top
- Double Top
- Triple Bottom
- Triple Bottom
- Triple Top
- Triple Top
- All
- All
- Buy
- Sale
- All
- 1
- 2
- 3
- 4
- 5
ट्रिपल टॉप
was formed on 24.03 at 23:01:00 (UTC+0)
signal strength 1 of 5

EURJPY M5 के चार्ट पर ट्रिपल टॉप पैटर्न बना है। पैटर्न की विशेषताएं: सीमाओं में एक आरोही कोण मौजूद है; पैटर्न की निचली रेखा 162.59/162.72 पर है और ऊपरी सीमा
M5 और M15 समय सीमा में अधिक फाल्स एंट्री पॉइंट्स हो सकते हैं।
Open chart in a new window
बुलिश फ्लैग
was formed on 24.03 at 23:00:23 (UTC+0)
signal strength 2 of 5

बुलिश फ्लैग पैटर्न NZDJPY M15 चार्ट पर बनाया गया है जो दर्शाता है कि ऊपर की ओर रुझान जारी रहेगा। संकेत: 86.28 पर शिखर के टूटने से कीमत अधिक हो
M5 और M15 समय सीमा में अधिक फाल्स एंट्री पॉइंट्स हो सकते हैं।
Open chart in a new window
बुलिश सिमेट्रिकल त्रिभुज
was formed on 24.03 at 23:00:22 (UTC+0)
signal strength 1 of 5
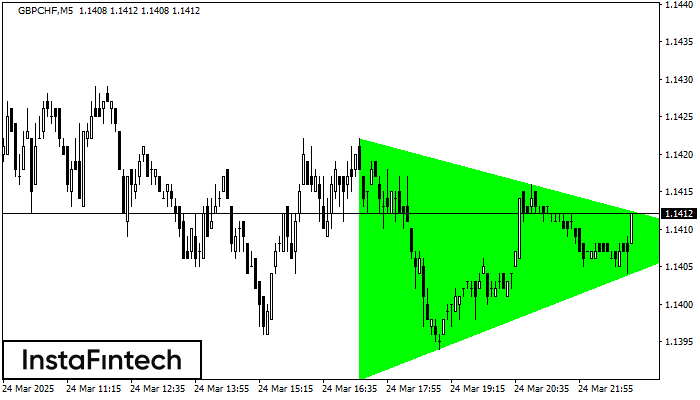
M5 के चार्ट के अनुसार, GBPCHF से बुलिश सिमेट्रिकल त्रिभुज पैटर्न बना। विवरण: यह एक ट्रेंड जारी रहने का पैटर्न है। 1.1422 और 1.1390 क्रमशः ऊपरी और निचली सीमाओं के
M5 और M15 समय सीमा में अधिक फाल्स एंट्री पॉइंट्स हो सकते हैं।
Open chart in a new window


