

实际模式

模式是通过价格在图表中形成的图形模型。 根据其中一项技术分析规定,历史(价格变动)重演。 这意味着价格变动在相同的情况下通常是相似的,这使得有可能以高概率预测情况的进一步发展。
InstaTrade的相关模式是一款易于使用的服务,可让您了解市场的最新变化并及时对市场线索做出反应。 在我们的服务中,您始终可以在任何货币对以及任何时间范围内找到最新和最相关的模式。
Bearish pennant
was formed on 17.03 at 09:46:53 (UTC+0)
signal strength 1 of 5
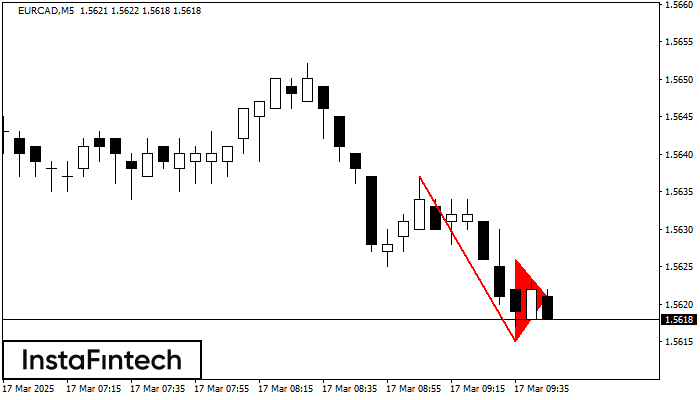
The Bearish pennant pattern has formed on the EURCAD M5 chart. This pattern type is characterized by a slight slowdown after which the price will move in the direction of the original trend. In case the price fixes below the pattern’s low of 1.5615, a trader will be able to successfully enter the sell position.
The M5 and M15 time frames may have more false entry points.
See Also
- All
- All
- Bearish Rectangle
- Bearish Symmetrical Triangle
- Bearish Symmetrical Triangle
- Bullish Rectangle
- Double Top
- Double Top
- Triple Bottom
- Triple Bottom
- Triple Top
- Triple Top
- All
- All
- Buy
- Sale
- All
- 1
- 2
- 3
- 4
- 5
Pennant de alta
was formed on 17.03 at 19:27:45 (UTC+0)
signal strength 1 of 5
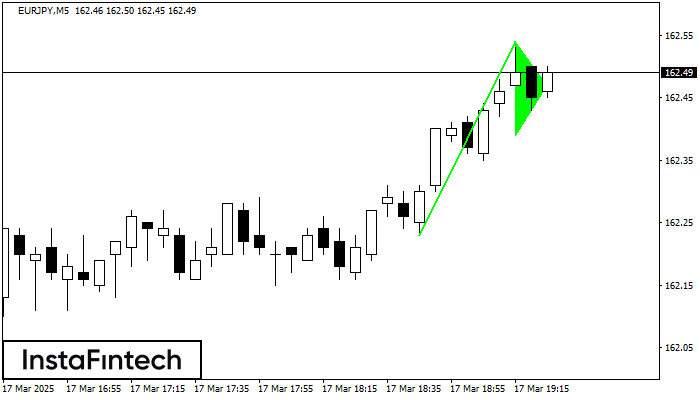
O padrão Pennant de alta é formado no gráfico EURJPY M5. Ele é um tipo do padrão de continuação. Supostamente, se o preço for fixado acima da alta de 162.54
Os intervalos M5 e M15 podem ter mais pontos de entrada falsos.
Open chart in a new window
Retângulo de alta
was formed on 17.03 at 19:24:15 (UTC+0)
signal strength 3 of 5
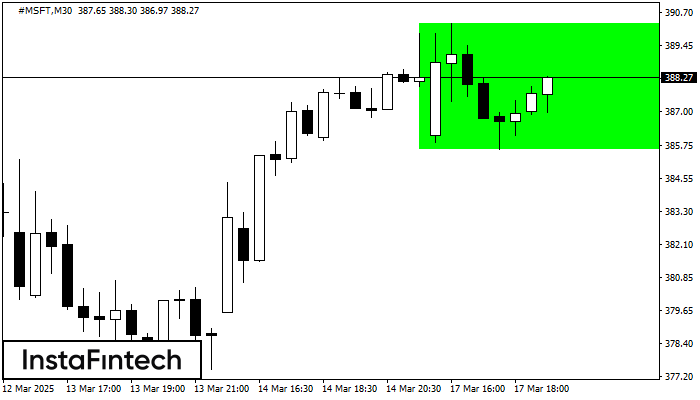
Conforme o gráfico de M30, #MSFT formou o Retângulo de alta. Este tipo de padrão indica uma continuação da tendência. Ele consiste em dois níveis: resistência 390.29 e suporte 385.61
Open chart in a new window
Retângulo de alta
was formed on 17.03 at 19:22:44 (UTC+0)
signal strength 2 of 5
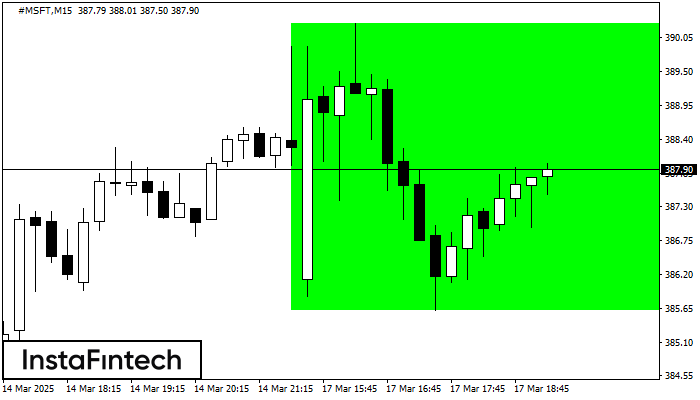
De acordo com o gráfico de M15, #MSFT formou o Retângulo de alta que é um padrão de uma continuação da tendência. O padrão está dentro dos seguintes limites
Os intervalos M5 e M15 podem ter mais pontos de entrada falsos.
Open chart in a new window


