

Padrões atuais

Padrões são modelos gráficos que são formados no gráfico pelo preço. Segundo um dos postulados da análise técnica, a história (movimento de preços) se repete. Isso significa que os movimentos de preços geralmente são semelhantes nas mesmas situações, o que possibilita prever o desenvolvimento futuro da situação com alta probabilidade.
Os padrões relevantes da InstaTrade são um serviço fácil de usar, que permite que você esteja ciente das últimas mudanças no mercado e reaja a indícios do mercado a tempo. Em nosso serviço, você sempre encontrará os padrões mais recentes e relevantes em qualquer par e em qualquer período gráfico.
Bullish Rectangle
was formed on 17.03 at 19:24:15 (UTC+0)
signal strength 3 of 5
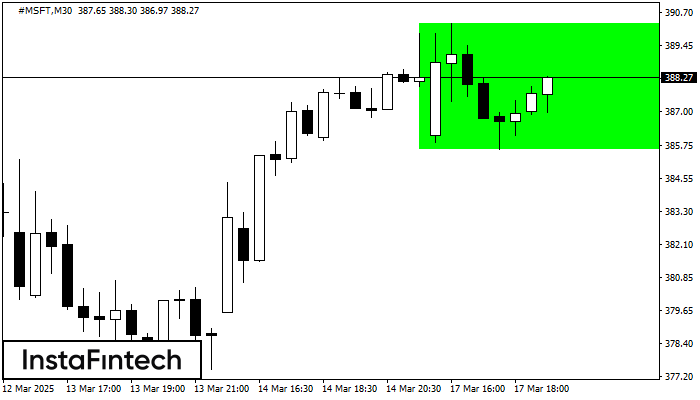
According to the chart of M30, #MSFT formed the Bullish Rectangle. This type of a pattern indicates a trend continuation. It consists of two levels: resistance 390.29 and support 385.61. In case the resistance level 390.29 - 390.29 is broken, the instrument is likely to follow the bullish trend.
Veja também
- All
- All
- Bearish Rectangle
- Bearish Symmetrical Triangle
- Bearish Symmetrical Triangle
- Bullish Rectangle
- Double Top
- Double Top
- Triple Bottom
- Triple Bottom
- Triple Top
- Triple Top
- All
- All
- Buy
- Sale
- All
- 1
- 2
- 3
- 4
- 5
Triângulo Simétrico de Baixa
was formed on 18.03 at 08:42:54 (UTC+0)
signal strength 1 of 5
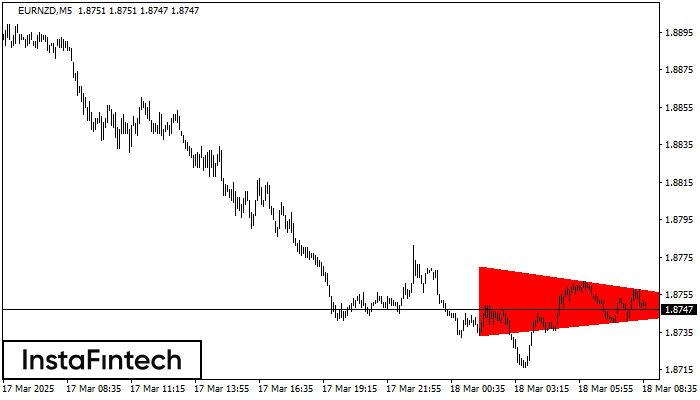
De acordo com o gráfico de M5, EURNZD formou o padrão Triângulo Simétrico de Baixa. Descrição: o limite inferior é 1.8733/1.8748 e o limite superior é 1.8770/1.8748. A largura
Os intervalos M5 e M15 podem ter mais pontos de entrada falsos.
Open chart in a new window
Cabeça & Ombros
was formed on 18.03 at 08:30:10 (UTC+0)
signal strength 3 of 5
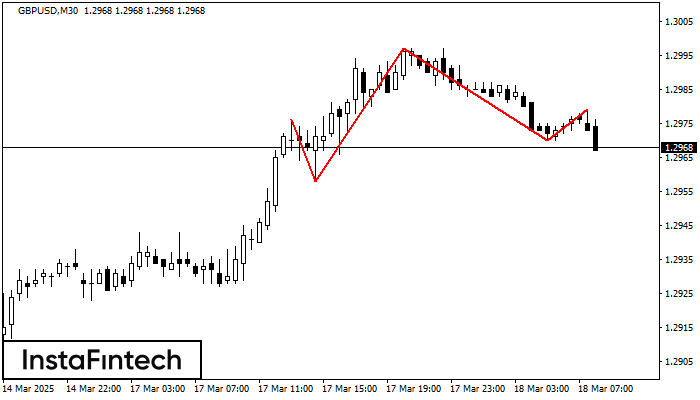
O padrão técnico chamado Cabeça & Ombros apareceu no gráfico de GBPUSD M30. Há razões de peso para sugerir que o preço ultrapassará a Linha do Pescoço 1.2958/1.2970 após
Open chart in a new window
Topo triplo
was formed on 18.03 at 08:01:01 (UTC+0)
signal strength 1 of 5
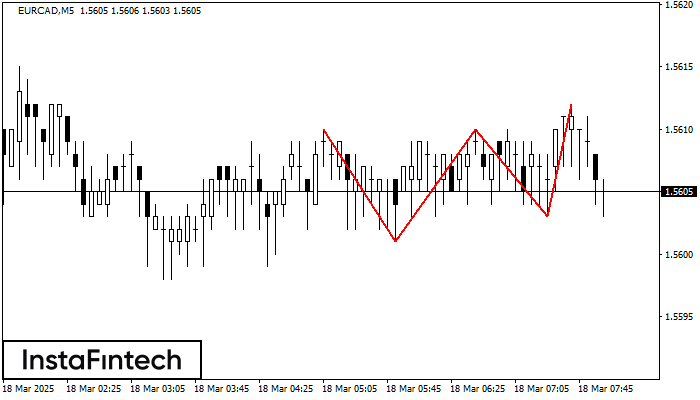
O padrão Topo triplo se formou no gráfico de EURCAD M5. Características do padrão: os limites têm um ângulo ascendente; a linha inferior do padrão tem as coordenadas 1.5601/1.5603
Os intervalos M5 e M15 podem ter mais pontos de entrada falsos.
Open chart in a new window


