

Các mẫu thực tế

Các mẫu là các mô hình đồ họa được hình thành trong biểu đồ theo giá. Theo một trong những định đề phân tích kỹ thuật, lịch sử (chuyển động giá) thường tự lặp lại. Có nghĩa là biến động giá thường giống nhau trong các tình huống giống nhau, do đó có thể dự đoán chuyển động tiếp theo của tình huống với xác suất cao.
Các mẫu hữu quan của InstaTrade là một dịch vụ dễ sử dụng cho phép bạn nhận biết được những thay đổi mới nhất trên thị trường và phản ứng kịp thời với các dấu hiệu từ thị trường. Trong dịch vụ của chúng tôi, bạn sẽ luôn tìm thấy các mẫu mới nhất và phù hợp nhất trên bất kỳ cặp nào và bất kỳ khung thời gian nào.
Bearish pennant
was formed on 18.03 at 18:47:10 (UTC+0)
signal strength 2 of 5
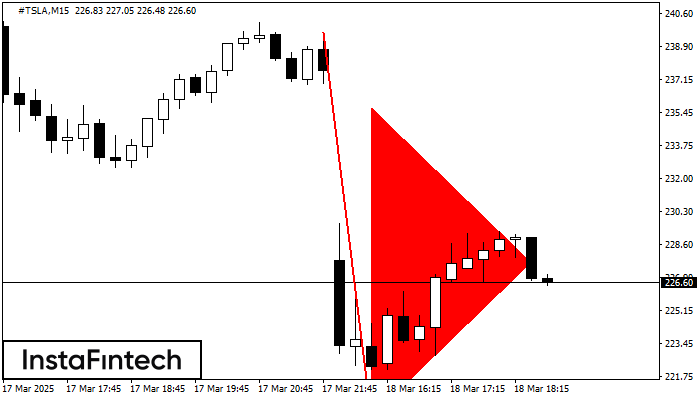
The Bearish pennant pattern has formed on the #TSLA M15 chart. It signals potential continuation of the existing trend. Specifications: the pattern’s bottom has the coordinate of 219.61; the projection of the flagpole height is equal to 2002 pips. In case the price breaks out the pattern’s bottom of 219.61, the downtrend is expected to continue for further level 219.38.
The M5 and M15 time frames may have more false entry points.
Xem thêm
- All
- All
- Bearish Rectangle
- Bearish Symmetrical Triangle
- Bearish Symmetrical Triangle
- Bullish Rectangle
- Double Top
- Double Top
- Triple Bottom
- Triple Bottom
- Triple Top
- Triple Top
- All
- All
- Buy
- Sale
- All
- 1
- 2
- 3
- 4
- 5
Tam giác Cân Tăng
was formed on 19.03 at 07:49:14 (UTC+0)
signal strength 3 of 5
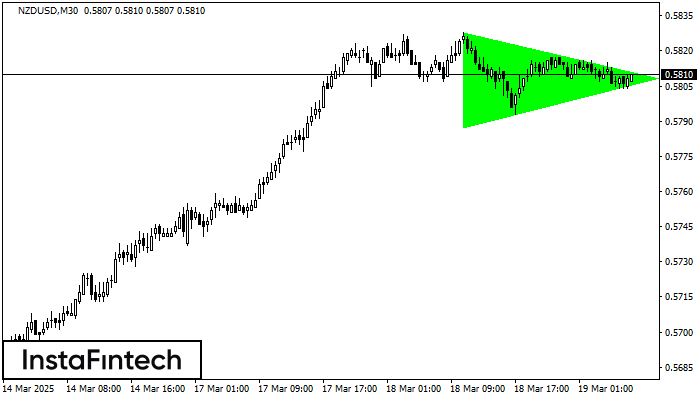
Theo biểu đồ của M30, NZDUSD đã hình thành mô hình Tam giác Cân Tăng. Mô tả: Đây là mô hình của sự tiếp tục xu hướng. 0.5828 và 0.5788
Open chart in a new window
Tam giác Cân Giảm
was formed on 19.03 at 07:40:54 (UTC+0)
signal strength 1 of 5
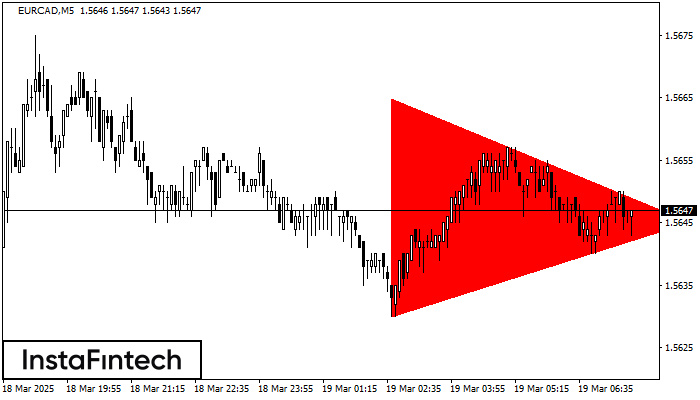
Theo biểu đồ của M5, EURCAD đã hình thành mô hình Tam giác Cân Giảm. Khuyến nghị giao dịch: Việc vi phạm biên giới thấp hơn 1.5630 có khả năng
Khung thời gian M5 và M15 có thể có nhiều điểm vào lệnh sai hơn.
Open chart in a new window
Đáy ba
was formed on 19.03 at 07:32:02 (UTC+0)
signal strength 3 of 5
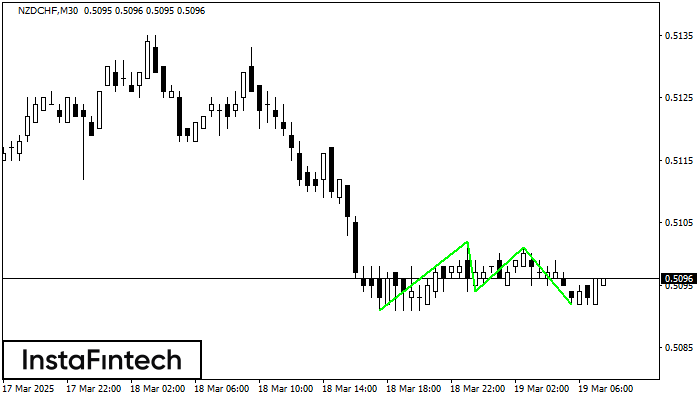
Mô hình Đáy ba đã được hình thành trên NZDCHF M30. Nó có các đặc điểm sau: mức kháng cự 0.5102/0.5101; mức hỗ trợ 0.5091/0.5092; chiều rộng là 11 điểm
Open chart in a new window
