

Các mẫu thực tế

Các mẫu là các mô hình đồ họa được hình thành trong biểu đồ theo giá. Theo một trong những định đề phân tích kỹ thuật, lịch sử (chuyển động giá) thường tự lặp lại. Có nghĩa là biến động giá thường giống nhau trong các tình huống giống nhau, do đó có thể dự đoán chuyển động tiếp theo của tình huống với xác suất cao.
Các mẫu hữu quan của InstaTrade là một dịch vụ dễ sử dụng cho phép bạn nhận biết được những thay đổi mới nhất trên thị trường và phản ứng kịp thời với các dấu hiệu từ thị trường. Trong dịch vụ của chúng tôi, bạn sẽ luôn tìm thấy các mẫu mới nhất và phù hợp nhất trên bất kỳ cặp nào và bất kỳ khung thời gian nào.
Double Top
was formed on 18.03 at 12:15:12 (UTC+0)
signal strength 1 of 5
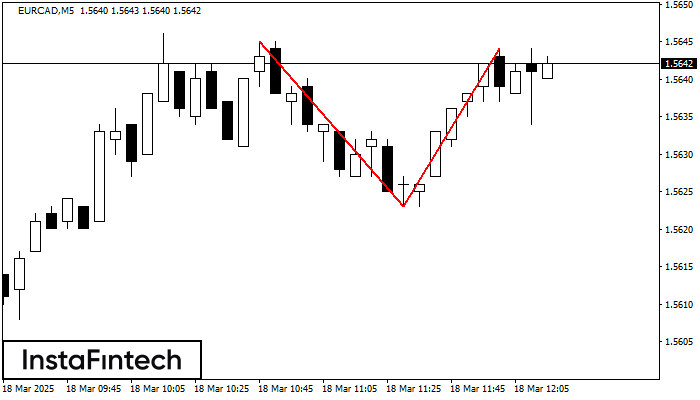
The Double Top reversal pattern has been formed on EURCAD M5. Characteristics: the upper boundary 1.5645; the lower boundary 1.5623; the width of the pattern is 21 points. Sell trades are better to be opened below the lower boundary 1.5623 with a possible movements towards the 1.5608 level.
The M5 and M15 time frames may have more false entry points.
Xem thêm
- All
- All
- Bearish Rectangle
- Bearish Symmetrical Triangle
- Bearish Symmetrical Triangle
- Bullish Rectangle
- Double Top
- Double Top
- Triple Bottom
- Triple Bottom
- Triple Top
- Triple Top
- All
- All
- Buy
- Sale
- All
- 1
- 2
- 3
- 4
- 5
Bullish Symmetrical Triangle
was formed on 19.03 at 22:31:16 (UTC+0)
signal strength 1 of 5
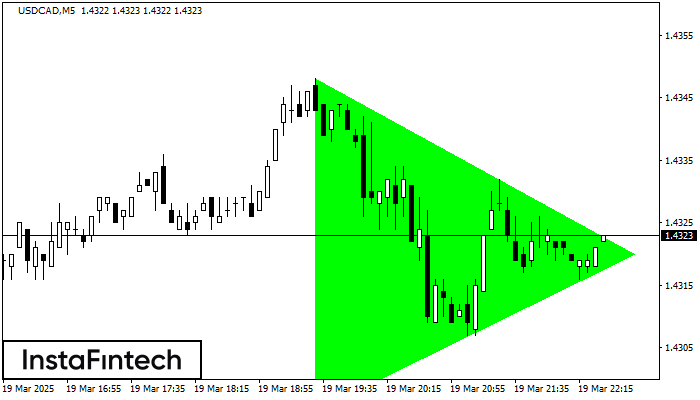
According to the chart of M5, USDCAD formed the Bullish Symmetrical Triangle pattern, which signals the trend will continue. Description. The upper border of the pattern touches the coordinates 1.4348/1.4320
The M5 and M15 time frames may have more false entry points.
Open chart in a new window
Double Top
was formed on 19.03 at 22:00:11 (UTC+0)
signal strength 4 of 5
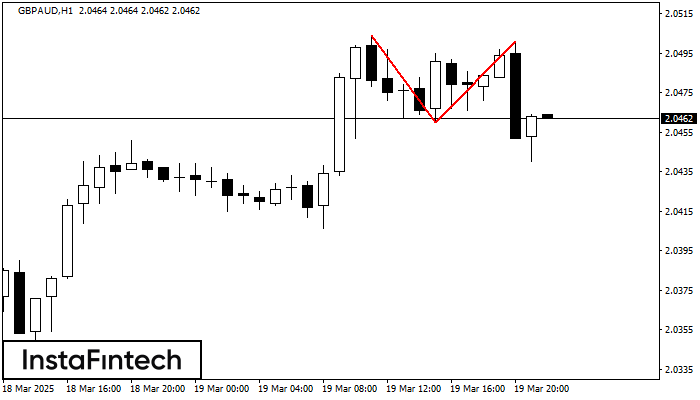
The Double Top pattern has been formed on GBPAUD H1. It signals that the trend has been changed from upwards to downwards. Probably, if the base of the pattern 2.0460
Open chart in a new window
Double Top
was formed on 19.03 at 21:55:13 (UTC+0)
signal strength 1 of 5
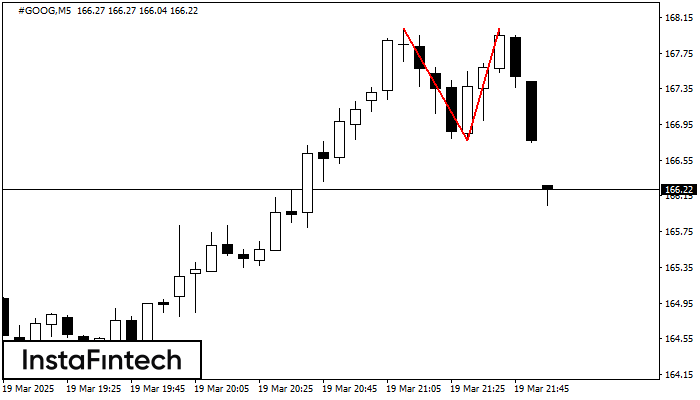
On the chart of #GOOG M5 the Double Top reversal pattern has been formed. Characteristics: the upper boundary 168.02; the lower boundary 166.77; the width of the pattern 125 points
The M5 and M15 time frames may have more false entry points.
Open chart in a new window
