

Dolzarb patternlar

Двойное дно
сформирован 03.04 в 14:19:55 (UTC+0)
сила сигнала 1 из 5
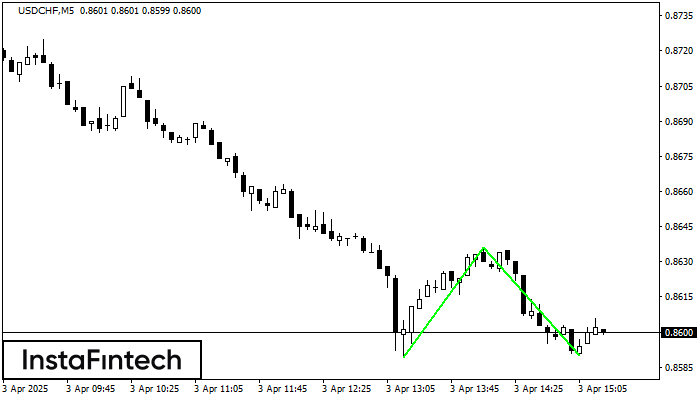
Сформирована фигура «Двойное дно» на графике USDCHF M5. Верхняя граница 0.8636; Нижняя граница 0.8590; Ширина фигуры 47 пунктов. В случае пробоя верхней границы 0.8636 можно будет прогнозировать изменение тенденции, где ширина фигуры и будет являться расстоянием предположительного Тейк Профита.
Таймфреймы М5 и М15 могут иметь больше ложных точек входа.
Shuningdek ko'ring
- Все
- Все
- Bearish Rectangle
- Bearish Symmetrical Triangle
- Bearish Symmetrical Triangle
- Bullish Rectangle
- Double Top
- Double Top
- Triple Bottom
- Triple Bottom
- Triple Top
- Triple Top
- Все
- Все
- Покупка
- Продажа
- Все
- 1
- 2
- 3
- 4
- 5
Double Top
сформирован 17.04 в 12:14:50 (UTC+0)
сила сигнала 1 из 5

The Double Top pattern has been formed on GBPUSD M5. It signals that the trend has been changed from upwards to downwards. Probably, if the base of the pattern 1.3238
The M5 and M15 time frames may have more false entry points.
Открыть график инструмента в новом окне
Head and Shoulders
сформирован 17.04 в 11:25:05 (UTC+0)
сила сигнала 1 из 5

The GBPAUD M5 formed the Head and Shoulders pattern with the following features: The Head’s top is at 2.0878, the Neckline and the upward angle are at 2.0820/2.0825. The formation
The M5 and M15 time frames may have more false entry points.
Открыть график инструмента в новом окне
Bearish Rectangle
сформирован 17.04 в 11:10:15 (UTC+0)
сила сигнала 1 из 5

According to the chart of M5, GOLD formed the Bearish Rectangle which is a pattern of a trend continuation. The pattern is contained within the following borders: lower border 3312.24
The M5 and M15 time frames may have more false entry points.
Открыть график инструмента в новом окне


