

Dolzarb patternlar

Двойная вершина
сформирован 31.03 в 10:30:55 (UTC+0)
сила сигнала 3 из 5
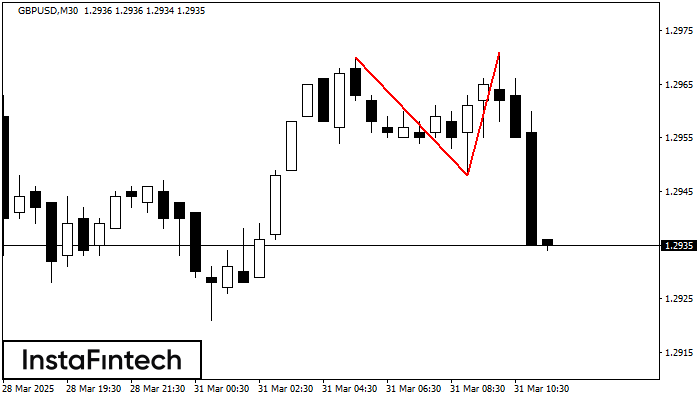
По GBPUSD на M30 сформировалась разворотная фигура «Двойная вершина». Характеристика: Верхняя граница 1.2970; Нижняя граница 1.2948; Ширина фигуры 23 пунктов. Позицию на продажу возможно открыть ниже нижней границы 1.2948, с перспективой хода к уровню 1.2918.
- Все
- Все
- Bearish Rectangle
- Bearish Symmetrical Triangle
- Bearish Symmetrical Triangle
- Bullish Rectangle
- Double Top
- Double Top
- Triple Bottom
- Triple Bottom
- Triple Top
- Triple Top
- Все
- Все
- Покупка
- Продажа
- Все
- 1
- 2
- 3
- 4
- 5
Bullish Symmetrical Triangle
was formed on 17.04 at 23:36:52 (UTC+0)
signal strength 1 of 5

According to the chart of M5, EURJPY formed the Bullish Symmetrical Triangle pattern. Description: This is the pattern of a trend continuation. 161.95 and 161.75 are the coordinates
The M5 and M15 time frames may have more false entry points.
Open chart in a new window
Bearish Symmetrical Triangle
was formed on 17.04 at 23:30:07 (UTC+0)
signal strength 1 of 5

According to the chart of M5, USDCHF formed the Bearish Symmetrical Triangle pattern. Description: The lower border is 0.8182/0.8188 and upper border is 0.8195/0.8188. The pattern width is measured
The M5 and M15 time frames may have more false entry points.
Open chart in a new window
Bearish Rectangle
was formed on 17.04 at 23:30:00 (UTC+0)
signal strength 1 of 5
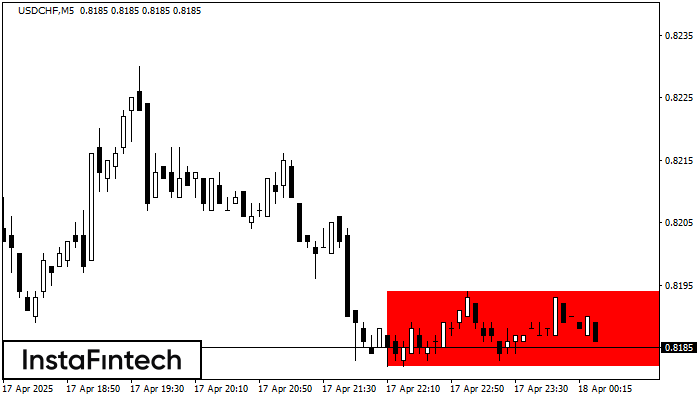
According to the chart of M5, USDCHF formed the Bearish Rectangle. The pattern indicates a trend continuation. The upper border is 0.8194, the lower border is 0.8182. The signal means
The M5 and M15 time frames may have more false entry points.
Open chart in a new window


