

Dolzarb patternlar

Двойное дно
сформирован 31.03 в 09:45:35 (UTC+0)
сила сигнала 2 из 5
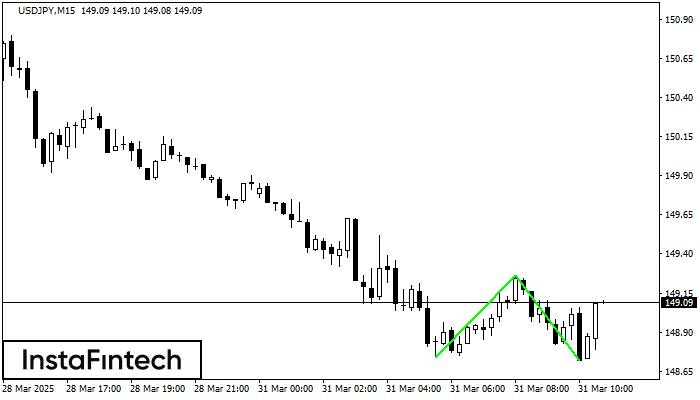
Сформирована фигура «Двойное дно» на графике USDJPY M15. Характеристика: Уровень поддержки 148.74; Уровень сопротивления 149.26; Ширина фигуры 52 пунктов. В случае пробоя уровня сопротивления можно будет прогнозировать изменение тенденции, где первая точка фиксации прибыли находится на расстоянии 54 пунктов.
Таймфреймы М5 и М15 могут иметь больше ложных точек входа.
Shuningdek ko'ring
- Все
- Все
- Bearish Rectangle
- Bearish Symmetrical Triangle
- Bearish Symmetrical Triangle
- Bullish Rectangle
- Double Top
- Double Top
- Triple Bottom
- Triple Bottom
- Triple Top
- Triple Top
- Все
- Все
- Покупка
- Продажа
- Все
- 1
- 2
- 3
- 4
- 5
Bullish Symmetrical Triangle
was formed on 11.04 at 08:06:10 (UTC+0)
signal strength 1 of 5
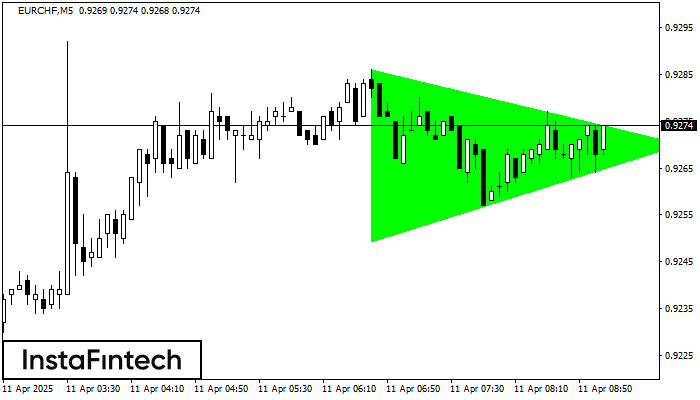
According to the chart of M5, EURCHF formed the Bullish Symmetrical Triangle pattern. The lower border of the pattern touches the coordinates 0.9249/0.9270 whereas the upper border goes across 0.9286/0.9270
The M5 and M15 time frames may have more false entry points.
Open chart in a new window
Inverse Head and Shoulder
was formed on 11.04 at 08:05:06 (UTC+0)
signal strength 1 of 5
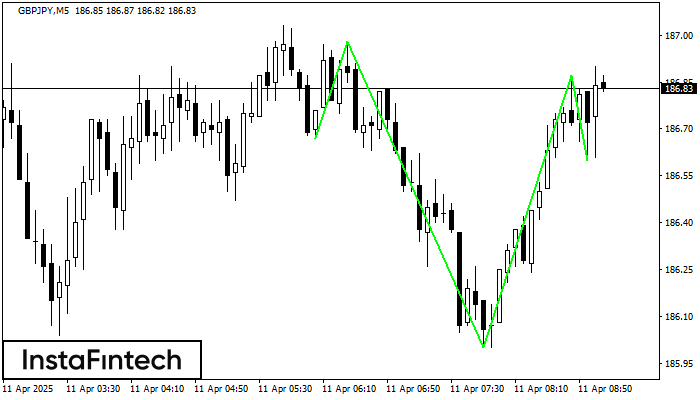
According to the chart of M5, GBPJPY produced the pattern termed the Inverse Head and Shoulder. The Head is fixed at 186.00 while the median line of the Neck
The M5 and M15 time frames may have more false entry points.
Open chart in a new window
Bullish Symmetrical Triangle
was formed on 11.04 at 07:59:53 (UTC+0)
signal strength 1 of 5
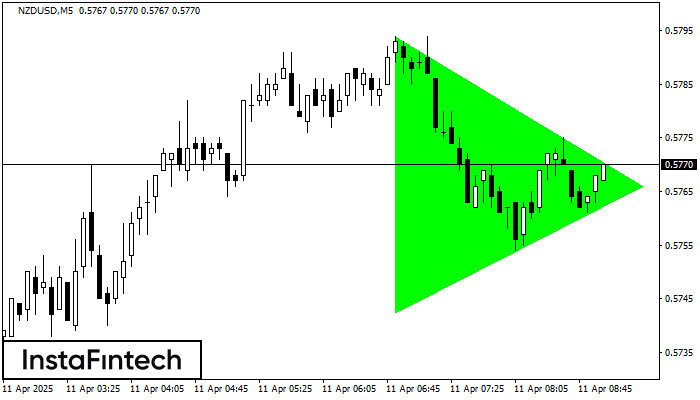
According to the chart of M5, NZDUSD formed the Bullish Symmetrical Triangle pattern. Description: This is the pattern of a trend continuation. 0.5794 and 0.5742 are the coordinates
The M5 and M15 time frames may have more false entry points.
Open chart in a new window


