

Dolzarb patternlar

Прямоугольник
сформирован 27.03 в 17:02:05 (UTC+0)
сила сигнала 1 из 5
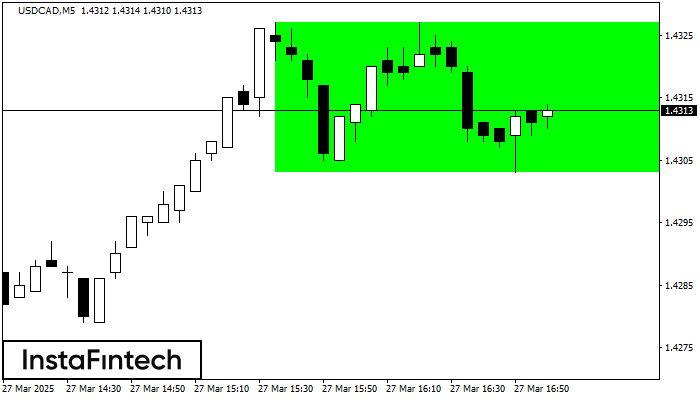
Сформирована фигура «Прямоугольник» на графике USDCAD M5. Тип фигуры: Продолжение тренда; Границы: Верхняя 1.4327, Нижняя 1.4303; Сигнал: позицию на покупку следует открывать выше верхней границы прямоугольника 1.4327.
Таймфреймы М5 и М15 могут иметь больше ложных точек входа.
Shuningdek ko'ring
- Все
- Все
- Bearish Rectangle
- Bearish Symmetrical Triangle
- Bearish Symmetrical Triangle
- Bullish Rectangle
- Double Top
- Double Top
- Triple Bottom
- Triple Bottom
- Triple Top
- Triple Top
- Все
- Все
- Покупка
- Продажа
- Все
- 1
- 2
- 3
- 4
- 5
Double Bottom
сформирован 02.04 в 11:20:53 (UTC+0)
сила сигнала 1 из 5

The Double Bottom pattern has been formed on EURNZD M5. Characteristics: the support level 1.8799; the resistance level 1.8817; the width of the pattern 18 points. If the resistance level
The M5 and M15 time frames may have more false entry points.
Открыть график инструмента в новом окне
Inverse Head and Shoulder
сформирован 02.04 в 11:00:29 (UTC+0)
сила сигнала 4 из 5
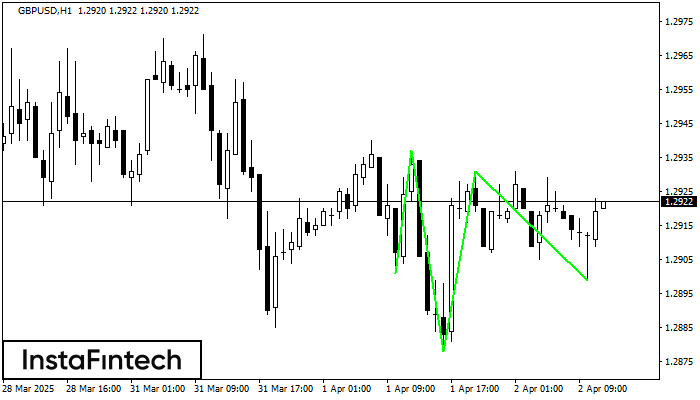
According to H1, GBPUSD is shaping the technical pattern – the Inverse Head and Shoulder. In case the Neckline 1.2937/1.2931 is broken out, the instrument is likely to move toward
Открыть график инструмента в новом окне
Double Bottom
сформирован 02.04 в 11:00:06 (UTC+0)
сила сигнала 4 из 5
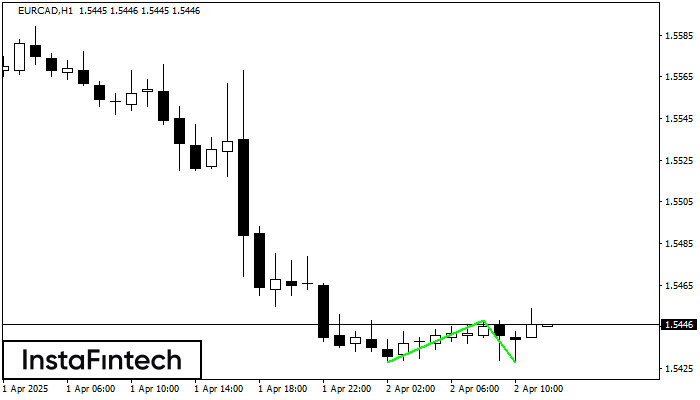
The Double Bottom pattern has been formed on EURCAD H1; the upper boundary is 1.5448; the lower boundary is 1.5428. The width of the pattern is 20 points. In case
Открыть график инструмента в новом окне


