

Dolzarb patternlar

Двойная вершина
сформирован 21.03 в 20:10:26 (UTC+0)
сила сигнала 1 из 5
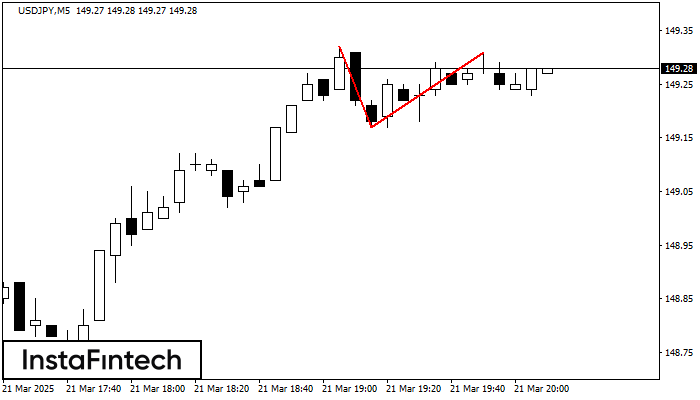
На торговом графике USDJPY M5 сформировалась разворотная фигура «Двойная вершина». Характеристика: Верхняя граница 149.31; Нижняя граница 149.17; Ширина фигуры 14 пунктов. Сигнал: Пробой нижней границы 149.17 приведет к дальнейшему нисходящему движению с перспективой хода к уровню 149.02.
Таймфреймы М5 и М15 могут иметь больше ложных точек входа.
Shuningdek ko'ring
- Все
- Все
- Bearish Rectangle
- Bearish Symmetrical Triangle
- Bearish Symmetrical Triangle
- Bullish Rectangle
- Double Top
- Double Top
- Triple Bottom
- Triple Bottom
- Triple Top
- Triple Top
- Все
- Все
- Покупка
- Продажа
- Все
- 1
- 2
- 3
- 4
- 5
Triple Top
сформирован 24.03 в 23:01:00 (UTC+0)
сила сигнала 1 из 5

The Triple Top pattern has formed on the chart of the EURJPY M5. Features of the pattern: borders have an ascending angle; the lower line of the pattern
The M5 and M15 time frames may have more false entry points.
Открыть график инструмента в новом окне
Bullish Flag
сформирован 24.03 в 23:00:23 (UTC+0)
сила сигнала 2 из 5

The Bullish Flag pattern has been formed on the chart NZDJPY M15 which signals that the upward trend will continue. Signals: а break of the peak at 86.28 may push
The M5 and M15 time frames may have more false entry points.
Открыть график инструмента в новом окне
Bullish Symmetrical Triangle
сформирован 24.03 в 23:00:22 (UTC+0)
сила сигнала 1 из 5
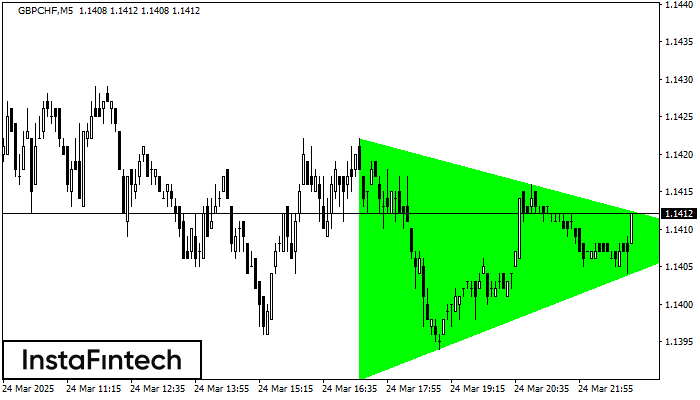
According to the chart of M5, GBPCHF formed the Bullish Symmetrical Triangle pattern. Description: This is the pattern of a trend continuation. 1.1422 and 1.1390 are the coordinates
The M5 and M15 time frames may have more false entry points.
Открыть график инструмента в новом окне


