Dolzarb patternlar

Тройная вершина
сформирован 21.03 в 01:30:16 (UTC+0)
сила сигнала 2 из 5
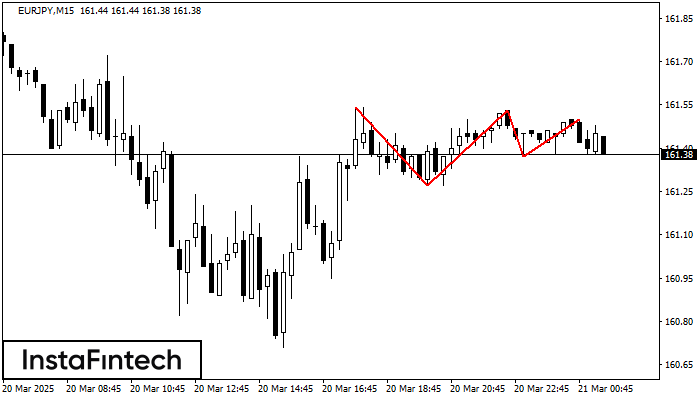
На графике EURJPY M15 образовалась фигура «Тройная вершина». Данная фигура относится к типу разворотных и имеет характеристику: Верхняя граница 161.54/161.50; Нижняя граница 161.27/161.37; Ширина фигуры 16 пунктов. Прогноз: В случае пробоя нижней границы 161.27 вероятно дальнейшее нисходящее движение к уровню 161.30.
Таймфреймы М5 и М15 могут иметь больше ложных точек входа.
Shuningdek ko'ring
- Все
- Все
- Bearish Rectangle
- Bearish Symmetrical Triangle
- Bearish Symmetrical Triangle
- Bullish Rectangle
- Double Top
- Double Top
- Triple Bottom
- Triple Bottom
- Triple Top
- Triple Top
- Все
- Все
- Покупка
- Продажа
- Все
- 1
- 2
- 3
- 4
- 5
Bullish Rectangle
was formed on 25.03 at 01:16:00 (UTC+0)
signal strength 2 of 5
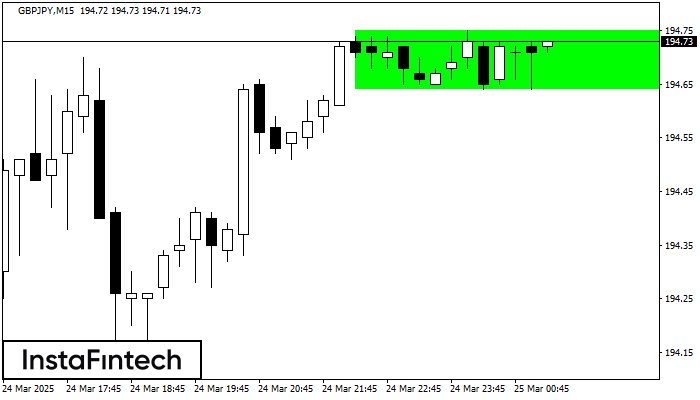
According to the chart of M15, GBPJPY formed the Bullish Rectangle. This type of a pattern indicates a trend continuation. It consists of two levels: resistance 194.75 and support 194.64
The M5 and M15 time frames may have more false entry points.
Open chart in a new window
Double Top
was formed on 25.03 at 01:00:30 (UTC+0)
signal strength 3 of 5
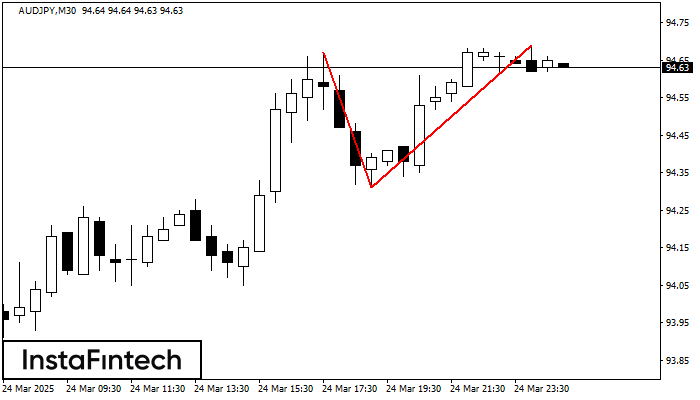
On the chart of AUDJPY M30 the Double Top reversal pattern has been formed. Characteristics: the upper boundary 94.69; the lower boundary 94.31; the width of the pattern 38 points
Open chart in a new window
Bullish Rectangle
was formed on 25.03 at 00:41:00 (UTC+0)
signal strength 1 of 5
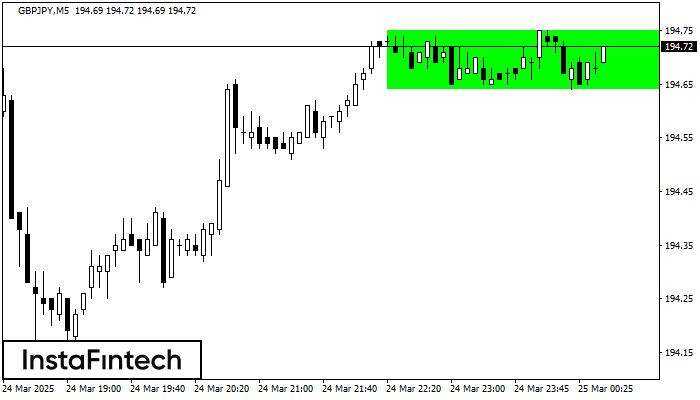
According to the chart of M5, GBPJPY formed the Bullish Rectangle. This type of a pattern indicates a trend continuation. It consists of two levels: resistance 194.75 and support 194.64
The M5 and M15 time frames may have more false entry points.
Open chart in a new window