

Dolzarb patternlar

Двойная вершина
сформирован 19.03 в 21:55:13 (UTC+0)
сила сигнала 1 из 5
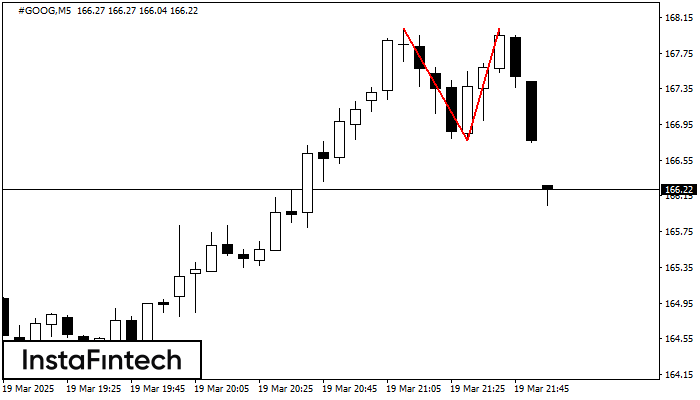
На торговом графике #GOOG M5 сформировалась разворотная фигура «Двойная вершина». Характеристика: Верхняя граница 168.02; Нижняя граница 166.77; Ширина фигуры 125 пунктов. Сигнал: Пробой нижней границы 166.77 приведет к дальнейшему нисходящему движению с перспективой хода к уровню 166.62.
Таймфреймы М5 и М15 могут иметь больше ложных точек входа.
- Все
- Все
- Bearish Rectangle
- Bearish Symmetrical Triangle
- Bearish Symmetrical Triangle
- Bullish Rectangle
- Double Top
- Double Top
- Triple Bottom
- Triple Bottom
- Triple Top
- Triple Top
- Все
- Все
- Покупка
- Продажа
- Все
- 1
- 2
- 3
- 4
- 5
Double Top
сформирован 21.03 в 22:15:10 (UTC+0)
сила сигнала 1 из 5
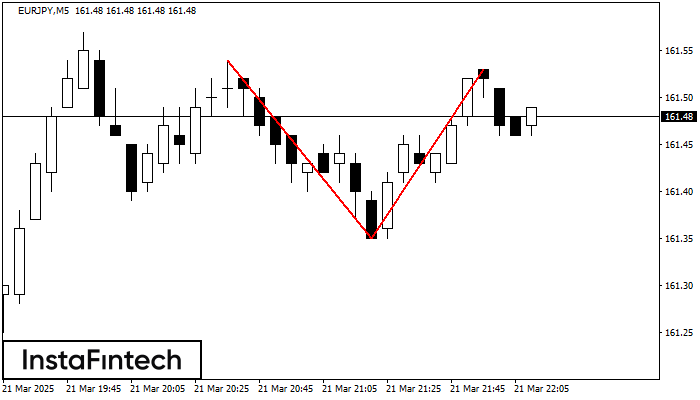
The Double Top reversal pattern has been formed on EURJPY M5. Characteristics: the upper boundary 161.54; the lower boundary 161.35; the width of the pattern is 18 points. Sell trades
The M5 and M15 time frames may have more false entry points.
Открыть график инструмента в новом окне
Double Top
сформирован 21.03 в 22:00:07 (UTC+0)
сила сигнала 2 из 5
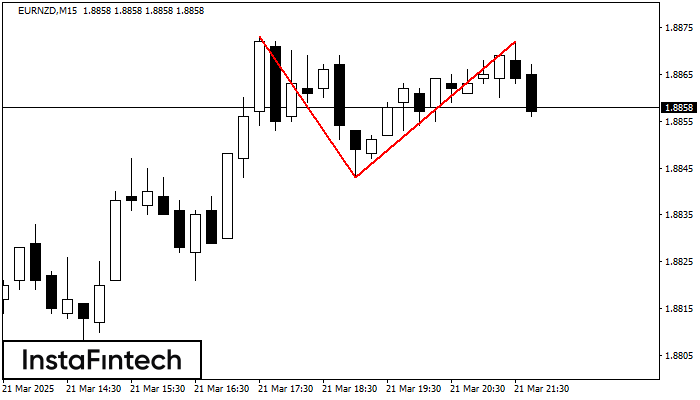
The Double Top reversal pattern has been formed on EURNZD M15. Characteristics: the upper boundary 1.8873; the lower boundary 1.8843; the width of the pattern is 29 points. Sell trades
The M5 and M15 time frames may have more false entry points.
Открыть график инструмента в новом окне
Bearish Rectangle
сформирован 21.03 в 21:46:26 (UTC+0)
сила сигнала 1 из 5

According to the chart of M5, USDCAD formed the Bearish Rectangle which is a pattern of a trend continuation. The pattern is contained within the following borders: lower border 1.4338
The M5 and M15 time frames may have more false entry points.
Открыть график инструмента в новом окне


