

Dolzarb patternlar

Двойная вершина
сформирован 18.03 в 12:15:12 (UTC+0)
сила сигнала 1 из 5
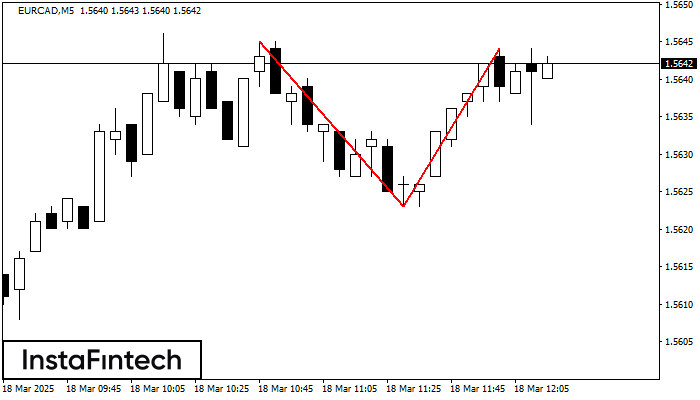
По EURCAD на M5 сформировалась разворотная фигура «Двойная вершина». Характеристика: Верхняя граница 1.5645; Нижняя граница 1.5623; Ширина фигуры 21 пунктов. Позицию на продажу возможно открыть ниже нижней границы 1.5623, с перспективой хода к уровню 1.5608.
Таймфреймы М5 и М15 могут иметь больше ложных точек входа.
Shuningdek ko'ring
- Все
- Все
- Bearish Rectangle
- Bearish Symmetrical Triangle
- Bearish Symmetrical Triangle
- Bullish Rectangle
- Double Top
- Double Top
- Triple Bottom
- Triple Bottom
- Triple Top
- Triple Top
- Все
- Все
- Покупка
- Продажа
- Все
- 1
- 2
- 3
- 4
- 5
Bullish Symmetrical Triangle
was formed on 19.03 at 22:31:16 (UTC+0)
signal strength 1 of 5
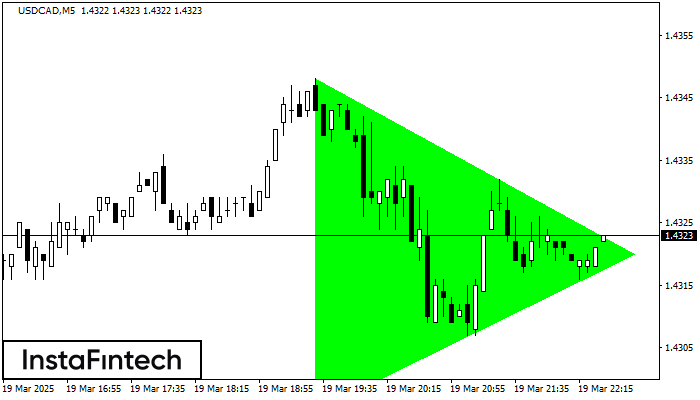
According to the chart of M5, USDCAD formed the Bullish Symmetrical Triangle pattern, which signals the trend will continue. Description. The upper border of the pattern touches the coordinates 1.4348/1.4320
The M5 and M15 time frames may have more false entry points.
Open chart in a new window
Double Top
was formed on 19.03 at 22:00:11 (UTC+0)
signal strength 4 of 5
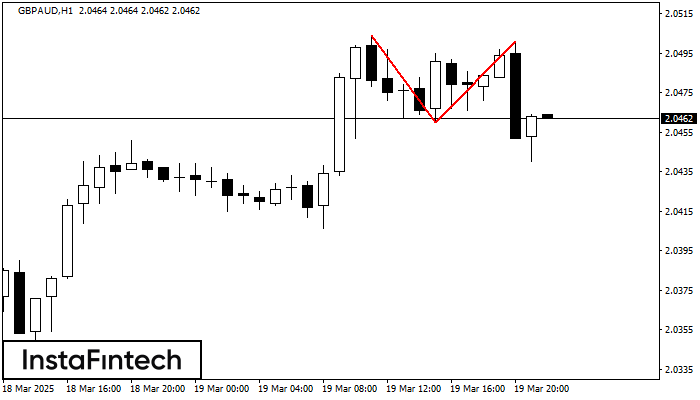
The Double Top pattern has been formed on GBPAUD H1. It signals that the trend has been changed from upwards to downwards. Probably, if the base of the pattern 2.0460
Open chart in a new window
Double Top
was formed on 19.03 at 21:55:13 (UTC+0)
signal strength 1 of 5
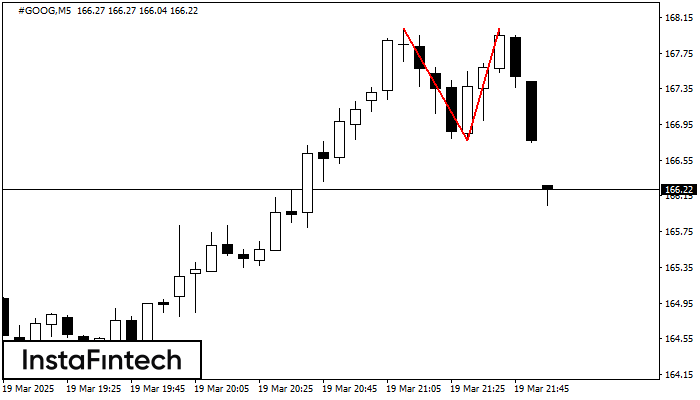
On the chart of #GOOG M5 the Double Top reversal pattern has been formed. Characteristics: the upper boundary 168.02; the lower boundary 166.77; the width of the pattern 125 points
The M5 and M15 time frames may have more false entry points.
Open chart in a new window


