

Dolzarb patternlar

Бычий флаг
сформирован 18.03 в 09:44:48 (UTC+0)
сила сигнала 1 из 5
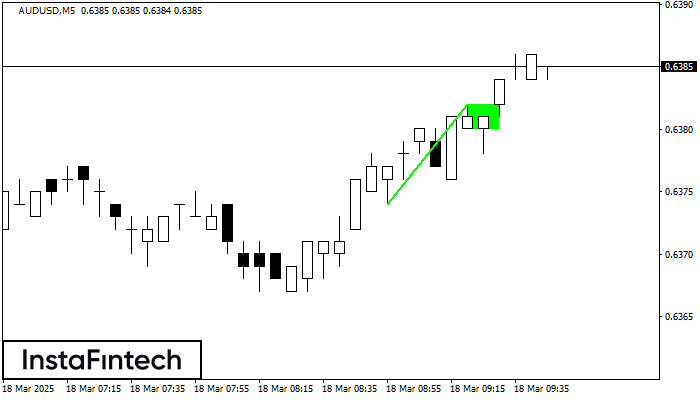
На графике AUDUSD M5 сформировалась фигура «Бычий флаг», которая сигнализирует о продолжении восходящего тренда. Сигналы: Пробой максимума фигуры 0.6382 может привести к продолжению восходящего движения, где рост инструмента будет являться проекцией высоты флагштока.
Таймфреймы М5 и М15 могут иметь больше ложных точек входа.
Shuningdek ko'ring
- Все
- Все
- Bearish Rectangle
- Bearish Symmetrical Triangle
- Bearish Symmetrical Triangle
- Bullish Rectangle
- Double Top
- Double Top
- Triple Bottom
- Triple Bottom
- Triple Top
- Triple Top
- Все
- Все
- Покупка
- Продажа
- Все
- 1
- 2
- 3
- 4
- 5
Triple Bottom
сформирован 18.03 в 18:15:41 (UTC+0)
сила сигнала 1 из 5
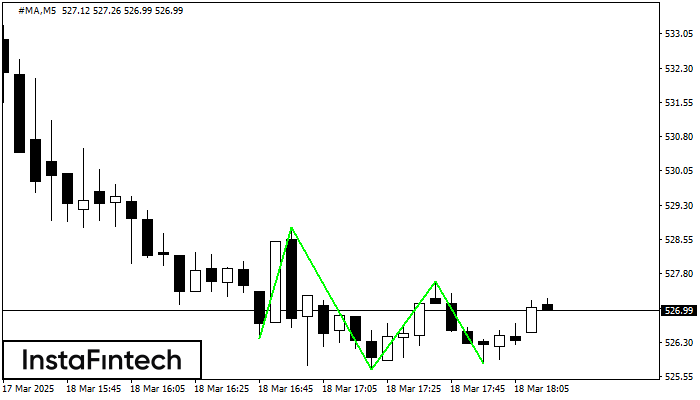
The Triple Bottom pattern has formed on the chart of the #MA M5 trading instrument. The pattern signals a change in the trend from downwards to upwards in the case
The M5 and M15 time frames may have more false entry points.
Открыть график инструмента в новом окне
Double Bottom
сформирован 18.03 в 17:14:56 (UTC+0)
сила сигнала 2 из 5
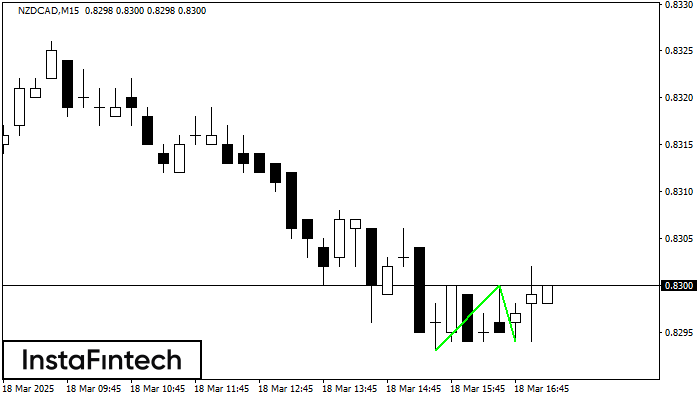
The Double Bottom pattern has been formed on NZDCAD M15; the upper boundary is 0.8300; the lower boundary is 0.8294. The width of the pattern is 7 points. In case
The M5 and M15 time frames may have more false entry points.
Открыть график инструмента в новом окне
Bearish Rectangle
сформирован 18.03 в 17:00:22 (UTC+0)
сила сигнала 2 из 5
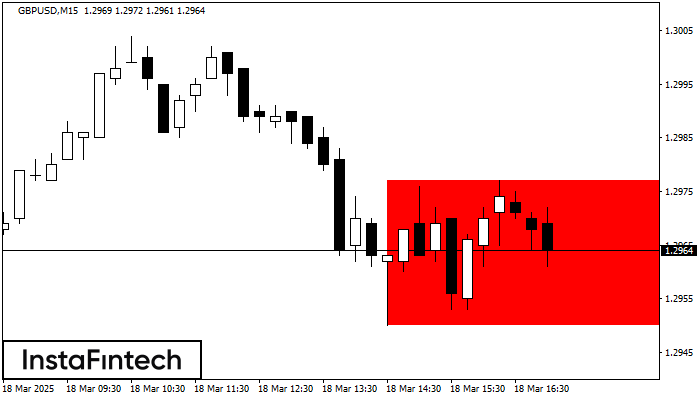
According to the chart of M15, GBPUSD formed the Bearish Rectangle which is a pattern of a trend continuation. The pattern is contained within the following borders: lower border 1.2950
The M5 and M15 time frames may have more false entry points.
Открыть график инструмента в новом окне


