

Dolzarb patternlar

Двойная вершина
сформирован 16.03 в 06:30:03 (UTC+0)
сила сигнала 1 из 5
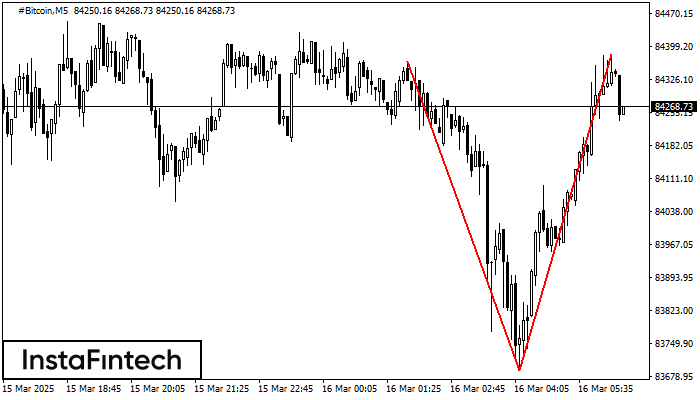
На торговом графике #Bitcoin M5 сформировалась разворотная фигура «Двойная вершина». Характеристика: Верхняя граница 84382.33; Нижняя граница 83691.55; Ширина фигуры 69078 пунктов. Сигнал: Пробой нижней границы 83691.55 приведет к дальнейшему нисходящему движению с перспективой хода к уровню 83691.40.
Таймфреймы М5 и М15 могут иметь больше ложных точек входа.
Shuningdek ko'ring
- Все
- Все
- Bearish Rectangle
- Bearish Symmetrical Triangle
- Bearish Symmetrical Triangle
- Bullish Rectangle
- Double Top
- Double Top
- Triple Bottom
- Triple Bottom
- Triple Top
- Triple Top
- Все
- Все
- Покупка
- Продажа
- Все
- 1
- 2
- 3
- 4
- 5
Double Top
was formed on 17.03 at 08:45:50 (UTC+0)
signal strength 1 of 5
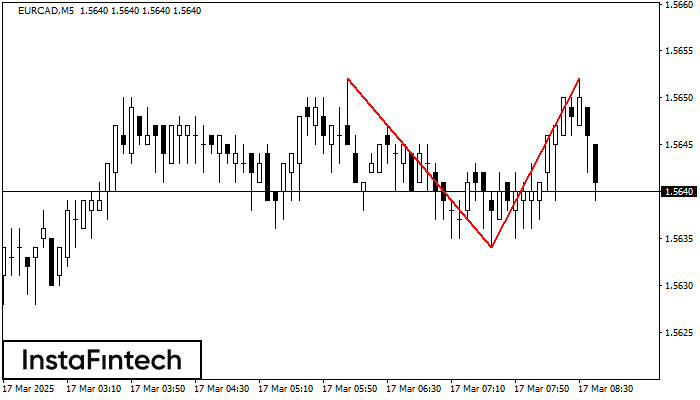
The Double Top pattern has been formed on EURCAD M5. It signals that the trend has been changed from upwards to downwards. Probably, if the base of the pattern 1.5634
The M5 and M15 time frames may have more false entry points.
Open chart in a new window
Double Top
was formed on 17.03 at 08:00:35 (UTC+0)
signal strength 2 of 5
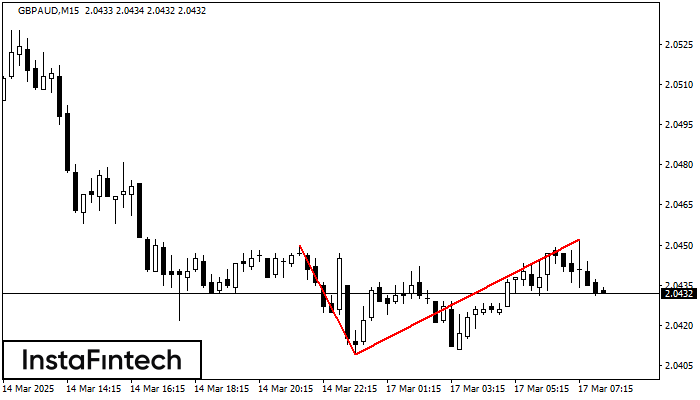
The Double Top pattern has been formed on GBPAUD M15. It signals that the trend has been changed from upwards to downwards. Probably, if the base of the pattern 2.0409
The M5 and M15 time frames may have more false entry points.
Open chart in a new window
Bullish Rectangle
was formed on 17.03 at 07:50:04 (UTC+0)
signal strength 1 of 5
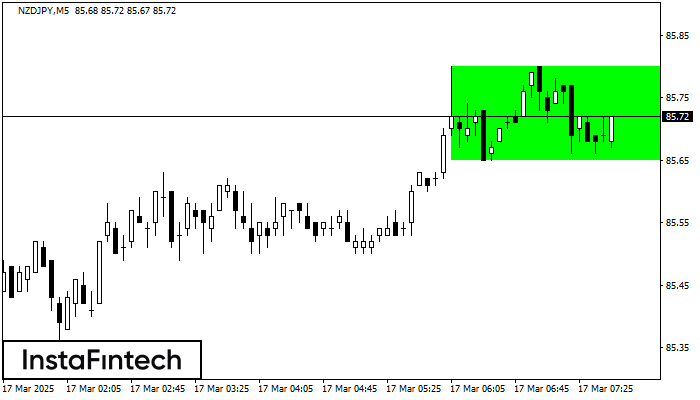
According to the chart of M5, NZDJPY formed the Bullish Rectangle. The pattern indicates a trend continuation. The upper border is 85.80, the lower border is 85.65. The signal means
The M5 and M15 time frames may have more false entry points.
Open chart in a new window


