

Актуальні патерни

Патерни - це графічні моделі, які "малюють" ціни на графіку. Один з постулатів технічного аналізу говорить нам про те, що історія (рух ціни) завжди повторюється. Це означає, що в схожих ситуаціях рух ціни, найчастіше, буде схожим, що дозволяє з високою часткою ймовірності спрогнозувати подальший розвиток ситуації.
Актуальні патерни від ІнстаФорекс - це зручний сервіс, який дозволить вам завжди бути в курсі останніх змін на ринку і вчасно реагувати на підказки, що з'явилися, від ринку. У нашому сервісі ви завжди знайдете найсвіжіші і актуальніші патерни на будь-якій парі і на будь-якому таймфреймі.
Двойное дно
сформирован 02.04 в 10:40:27 (UTC+0)
сила сигнала 1 из 5
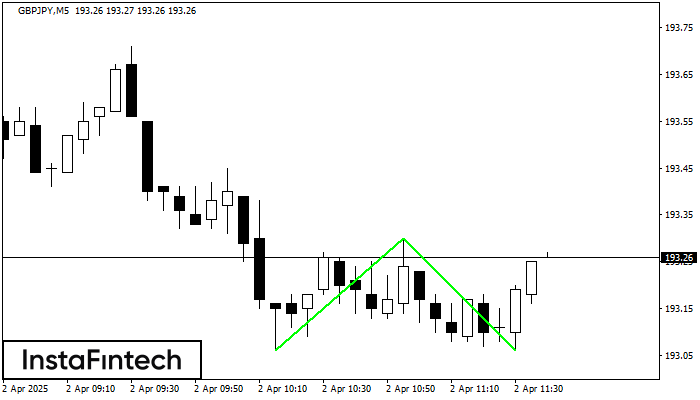
Сформирована фигура «Двойное дно» на графике GBPJPY M5. Верхняя граница 193.30; Нижняя граница 193.06; Ширина фигуры 24 пунктов. В случае пробоя верхней границы 193.30 можно будет прогнозировать изменение тенденции, где ширина фигуры и будет являться расстоянием предположительного Тейк Профита.
Таймфреймы М5 и М15 могут иметь больше ложных точек входа.
Дивіться також
- Все
- Все
- Bearish Rectangle
- Bearish Symmetrical Triangle
- Bearish Symmetrical Triangle
- Bullish Rectangle
- Double Top
- Double Top
- Triple Bottom
- Triple Bottom
- Triple Top
- Triple Top
- Все
- Все
- Покупка
- Продажа
- Все
- 1
- 2
- 3
- 4
- 5
Bearish Symmetrical Triangle
was formed on 11.04 at 09:13:08 (UTC+0)
signal strength 2 of 5
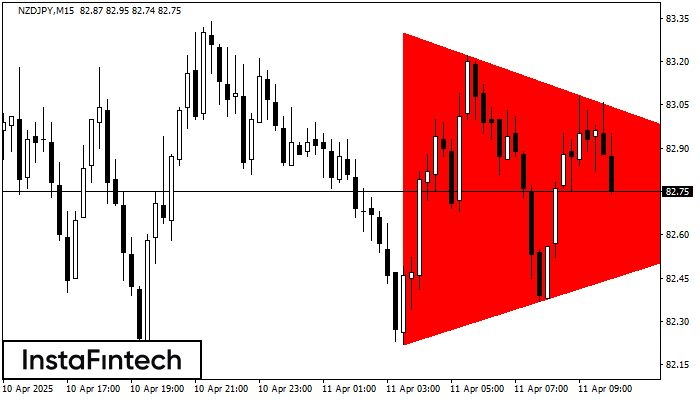
According to the chart of M15, NZDJPY formed the Bearish Symmetrical Triangle pattern. This pattern signals a further downward trend in case the lower border 82.22 is breached. Here
The M5 and M15 time frames may have more false entry points.
Open chart in a new window
Double Top
was formed on 11.04 at 08:59:57 (UTC+0)
signal strength 2 of 5
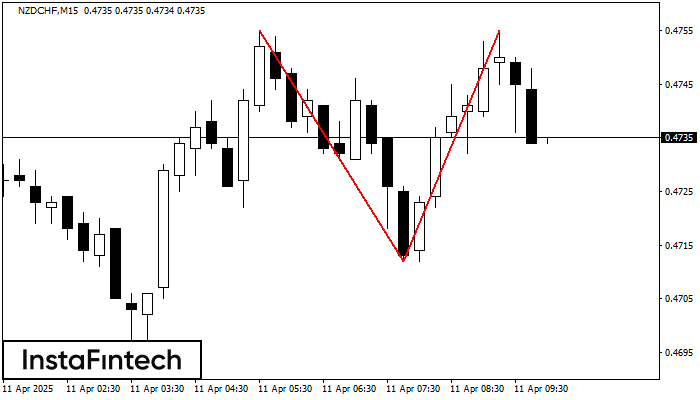
On the chart of NZDCHF M15 the Double Top reversal pattern has been formed. Characteristics: the upper boundary 0.4755; the lower boundary 0.4712; the width of the pattern 43 points
The M5 and M15 time frames may have more false entry points.
Open chart in a new window
Bearish Flag
was formed on 11.04 at 08:37:39 (UTC+0)
signal strength 1 of 5
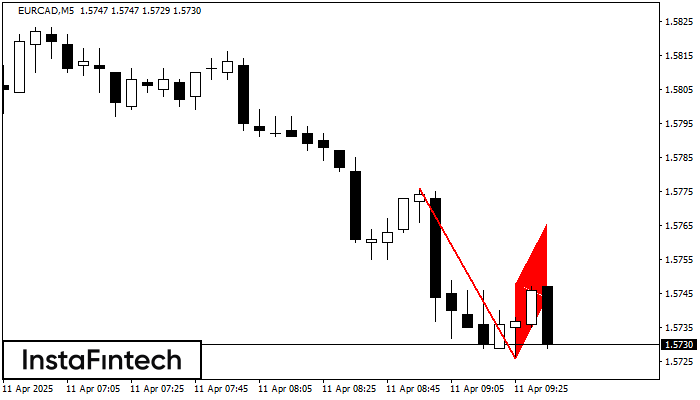
The Bearish Flag pattern has been formed on the chart EURCAD M5 which signals that the downward trend will continue. If the price breaks below the low at 1.5726, then
The M5 and M15 time frames may have more false entry points.
Open chart in a new window


