

Актуальні патерни

Патерни - це графічні моделі, які "малюють" ціни на графіку. Один з постулатів технічного аналізу говорить нам про те, що історія (рух ціни) завжди повторюється. Це означає, що в схожих ситуаціях рух ціни, найчастіше, буде схожим, що дозволяє з високою часткою ймовірності спрогнозувати подальший розвиток ситуації.
Актуальні патерни від ІнстаФорекс - це зручний сервіс, який дозволить вам завжди бути в курсі останніх змін на ринку і вчасно реагувати на підказки, що з'явилися, від ринку. У нашому сервісі ви завжди знайдете найсвіжіші і актуальніші патерни на будь-якій парі і на будь-якому таймфреймі.
Двойное дно
сформирован 21.03 в 02:00:28 (UTC+0)
сила сигнала 2 из 5
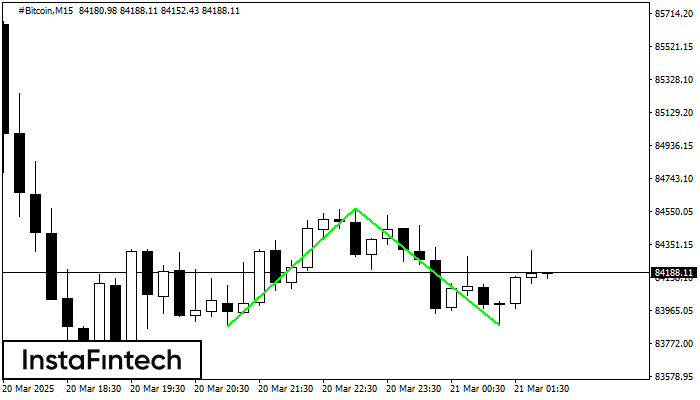
Сформирована фигура «Двойное дно» на графике #Bitcoin M15. Характеристика: Уровень поддержки 83872.78; Уровень сопротивления 84563.99; Ширина фигуры 69121 пунктов. В случае пробоя уровня сопротивления можно будет прогнозировать изменение тенденции, где первая точка фиксации прибыли находится на расстоянии 68635 пунктов.
Таймфреймы М5 и М15 могут иметь больше ложных точек входа.
Дивіться також
- Все
- Все
- Bearish Rectangle
- Bearish Symmetrical Triangle
- Bearish Symmetrical Triangle
- Bullish Rectangle
- Double Top
- Double Top
- Triple Bottom
- Triple Bottom
- Triple Top
- Triple Top
- Все
- Все
- Покупка
- Продажа
- Все
- 1
- 2
- 3
- 4
- 5
Triple Top
was formed on 31.03 at 20:05:23 (UTC+0)
signal strength 1 of 5
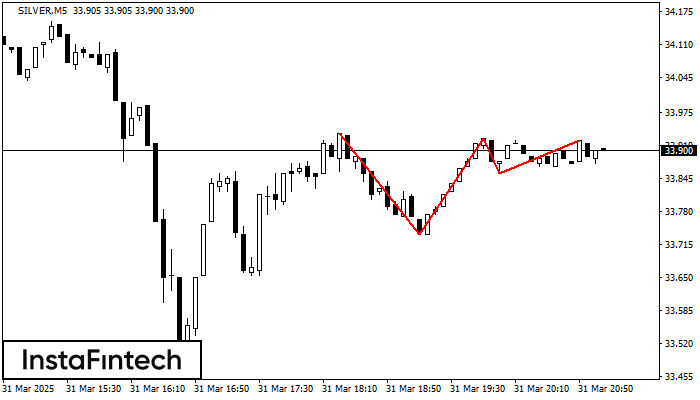
The Triple Top pattern has formed on the chart of the SILVER M5 trading instrument. It is a reversal pattern featuring the following characteristics: resistance level 15, support level -120
The M5 and M15 time frames may have more false entry points.
Open chart in a new window
Triple Top
was formed on 31.03 at 19:45:55 (UTC+0)
signal strength 1 of 5
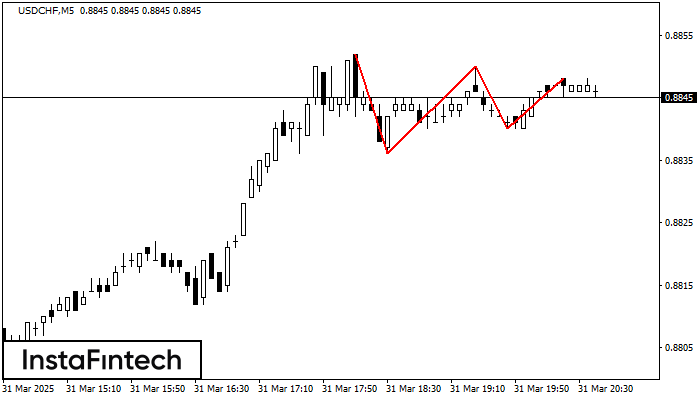
The Triple Top pattern has formed on the chart of the USDCHF M5 trading instrument. It is a reversal pattern featuring the following characteristics: resistance level 4, support level -4
The M5 and M15 time frames may have more false entry points.
Open chart in a new window
Bullish Rectangle
was formed on 31.03 at 19:02:59 (UTC+0)
signal strength 1 of 5
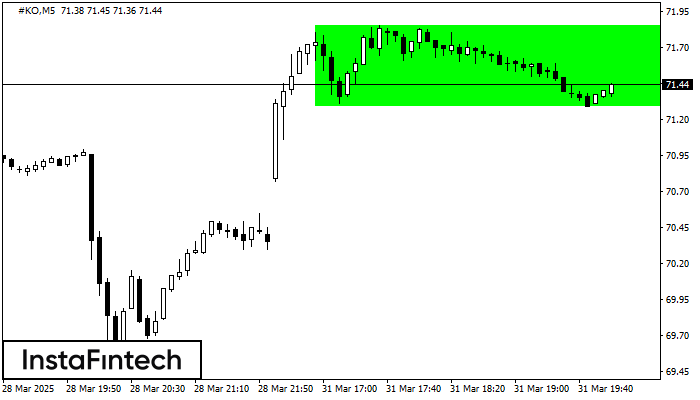
According to the chart of M5, #KO formed the Bullish Rectangle. The pattern indicates a trend continuation. The upper border is 71.85, the lower border is 71.29. The signal means
The M5 and M15 time frames may have more false entry points.
Open chart in a new window


