

Актуальні патерни

Патерни - це графічні моделі, які "малюють" ціни на графіку. Один з постулатів технічного аналізу говорить нам про те, що історія (рух ціни) завжди повторюється. Це означає, що в схожих ситуаціях рух ціни, найчастіше, буде схожим, що дозволяє з високою часткою ймовірності спрогнозувати подальший розвиток ситуації.
Актуальні патерни від ІнстаФорекс - це зручний сервіс, який дозволить вам завжди бути в курсі останніх змін на ринку і вчасно реагувати на підказки, що з'явилися, від ринку. У нашому сервісі ви завжди знайдете найсвіжіші і актуальніші патерни на будь-якій парі і на будь-якому таймфреймі.
Бычий вымпел
сформирован 17.03 в 17:47:39 (UTC+0)
сила сигнала 3 из 5
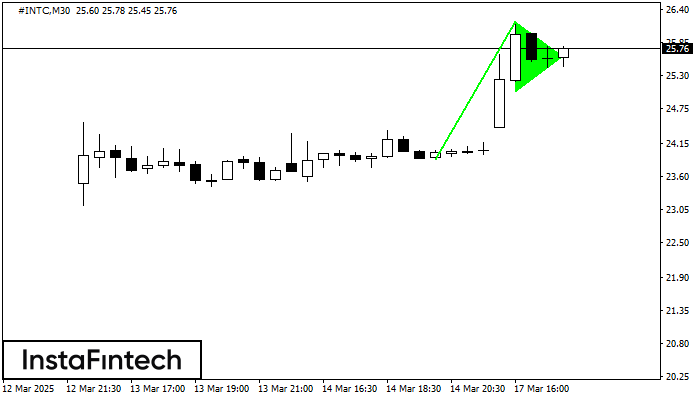
На графике #INTC M30 сформировался паттерн «Бычий вымпел», который относится к фигуре продолжения тренда. Можно предполагать, что, в случае фиксации цены выше максимума вымпела 26.20, возможно дальнейшее восходящее движение.
Дивіться також
- Все
- Все
- Bearish Rectangle
- Bearish Symmetrical Triangle
- Bearish Symmetrical Triangle
- Bullish Rectangle
- Double Top
- Double Top
- Triple Bottom
- Triple Bottom
- Triple Top
- Triple Top
- Все
- Все
- Покупка
- Продажа
- Все
- 1
- 2
- 3
- 4
- 5
Head and Shoulders
was formed on 18.03 at 15:45:00 (UTC+0)
signal strength 2 of 5
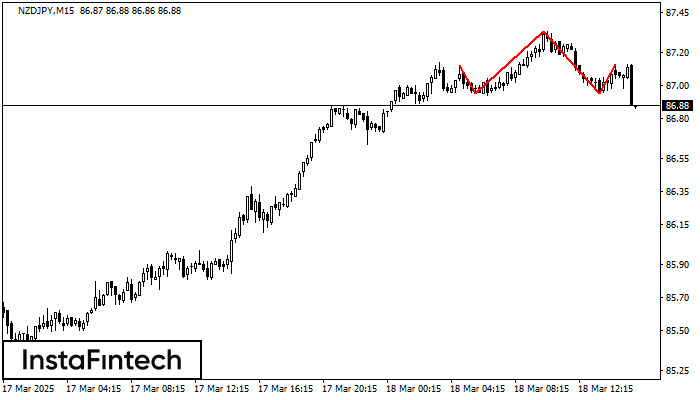
According to the chart of M15, NZDJPY formed the Head and Shoulders pattern. The Head’s top is set at 87.33 while the median line of the Neck is found
The M5 and M15 time frames may have more false entry points.
Open chart in a new window
Triple Top
was formed on 18.03 at 15:44:58 (UTC+0)
signal strength 2 of 5
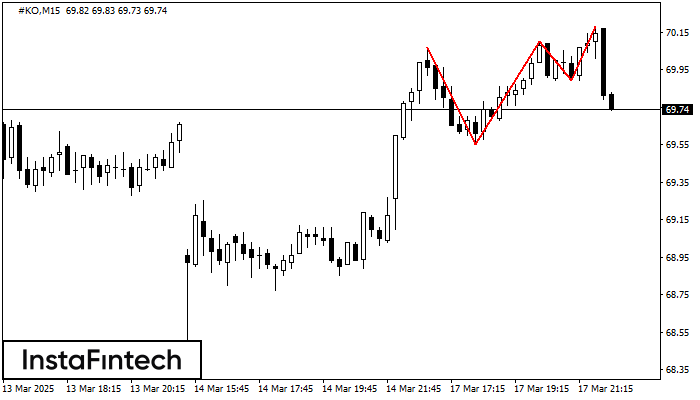
The Triple Top pattern has formed on the chart of the #KO M15. Features of the pattern: borders have an ascending angle; the lower line of the pattern
The M5 and M15 time frames may have more false entry points.
Open chart in a new window
Bullish Symmetrical Triangle
was formed on 18.03 at 15:44:52 (UTC+0)
signal strength 1 of 5
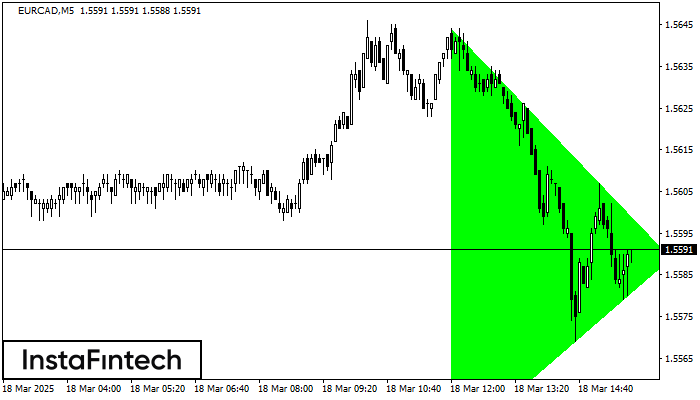
According to the chart of M5, EURCAD formed the Bullish Symmetrical Triangle pattern. Description: This is the pattern of a trend continuation. 1.5644 and 1.5543 are the coordinates
The M5 and M15 time frames may have more false entry points.
Open chart in a new window


