

Актуальні патерни

Патерни - це графічні моделі, які "малюють" ціни на графіку. Один з постулатів технічного аналізу говорить нам про те, що історія (рух ціни) завжди повторюється. Це означає, що в схожих ситуаціях рух ціни, найчастіше, буде схожим, що дозволяє з високою часткою ймовірності спрогнозувати подальший розвиток ситуації.
Актуальні патерни від ІнстаФорекс - це зручний сервіс, який дозволить вам завжди бути в курсі останніх змін на ринку і вчасно реагувати на підказки, що з'явилися, від ринку. У нашому сервісі ви завжди знайдете найсвіжіші і актуальніші патерни на будь-якій парі і на будь-якому таймфреймі.
Голова и плечи
сформирован 13.03 в 03:30:37 (UTC+0)
сила сигнала 3 из 5
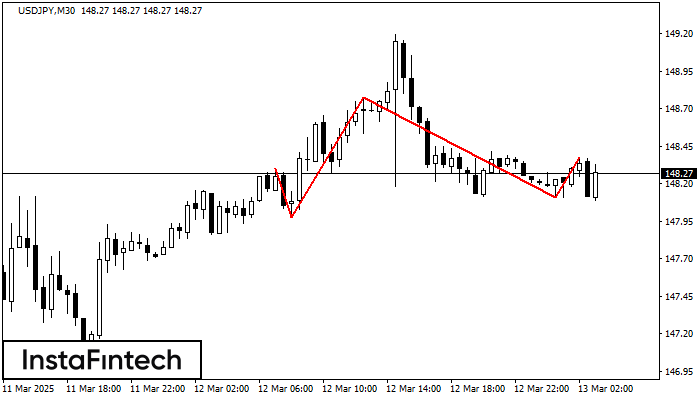
Графическая фигура «Голова и плечи» сформировалась по инструменту USDJPY на M30. Вероятно предполагать, что после формирования правого плеча цена преодолеет уровень шеи 147.98/148.11, изменяя тем самым тенденцию и фактически направляя нас к значению 147.81.
- Все
- Все
- Bearish Rectangle
- Bearish Symmetrical Triangle
- Bearish Symmetrical Triangle
- Bullish Rectangle
- Double Top
- Double Top
- Triple Bottom
- Triple Bottom
- Triple Top
- Triple Top
- Все
- Все
- Покупка
- Продажа
- Все
- 1
- 2
- 3
- 4
- 5
Triple Top
was formed on 18.03 at 22:35:18 (UTC+0)
signal strength 1 of 5
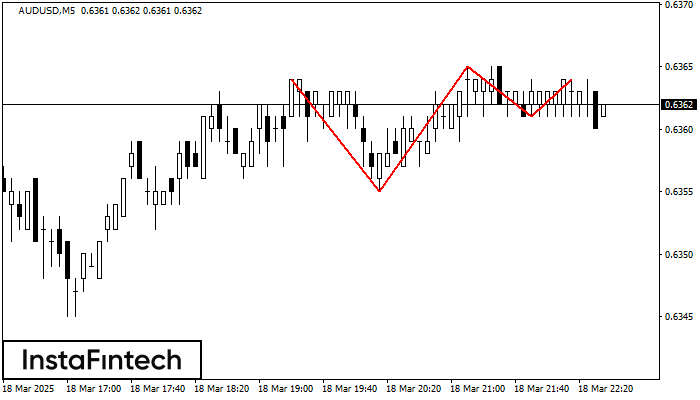
The Triple Top pattern has formed on the chart of the AUDUSD M5 trading instrument. It is a reversal pattern featuring the following characteristics: resistance level 0, support level -6
The M5 and M15 time frames may have more false entry points.
Open chart in a new window
Triple Top
was formed on 18.03 at 22:30:19 (UTC+0)
signal strength 1 of 5
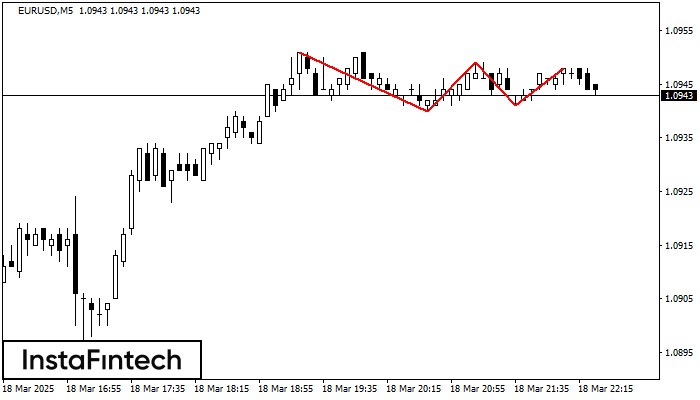
The Triple Top pattern has formed on the chart of the EURUSD M5. Features of the pattern: borders have an ascending angle; the lower line of the pattern
The M5 and M15 time frames may have more false entry points.
Open chart in a new window
Bullish Symmetrical Triangle
was formed on 18.03 at 22:03:18 (UTC+0)
signal strength 1 of 5
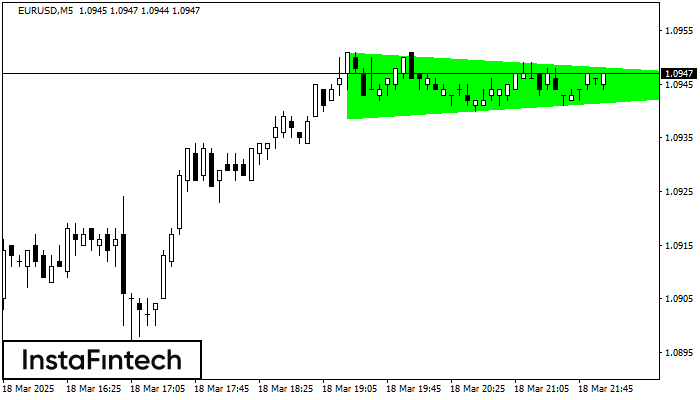
According to the chart of M5, EURUSD formed the Bullish Symmetrical Triangle pattern. Description: This is the pattern of a trend continuation. 1.0951 and 1.0939 are the coordinates
The M5 and M15 time frames may have more false entry points.
Open chart in a new window


