

รูปแบบกราฟ

รูปแบบกราฟนั้นเป็น รูปจำลองทางกราฟฟิกที่ถูกสร้างขึ้นมาในชาร์ตจากราคา อ้างอิงตามหนึ่งในการวิเคราะห์ทางเทคนิค ที่ตั้งสมมติฐานมาว่า ประวัติศาสตร์ (การเคลื่อนไหวของราคา) มักจะเกิดขึ้นซ้ำรอยเดิม นั้นหมายความว่า การเคลื่อนไหวของราคาก็หมือนกับ สถานการณ์หนึ่งที่จะสามารถทำการคาดการณ์ไปยังทิศทางในอนาคต ตามเหตุการณ์ที่น่าจะมีความเป็นไปได้สูง
รูปแบบกราฟที่สำคัญจากทาง InstaTrade นั้นจะเป็นการบริการที่มีการใช้อย่างง่ายดาย ซึ่งจะช่วยให้คุณสามารถทราบถึงการเปลี่ยนแปลงล่าสุด ในตลาดได้ และสามารถรับมือกับข้อมูลจากทางตลาดได้ทันท่วงที ในการบริการของพวกเรานั้น คุณจะพบกับรูปแบบกราฟล่าสุดและมีความสำคัญมากที่สุดในทุกๆคู่สกุลเงิน และทุกๆขอบเขตเวลา
Bullish Symmetrical Triangle
was formed on 27.03 at 23:09:03 (UTC+0)
signal strength 3 of 5

According to the chart of M30, AUDCHF formed the Bullish Symmetrical Triangle pattern, which signals the trend will continue. Description. The upper border of the pattern touches the coordinates 0.5593/0.5568 whereas the lower border goes across 0.5548/0.5568. The pattern width is measured on the chart at 45 pips. If the Bullish Symmetrical Triangle pattern is in progress during the upward trend, this indicates the current trend will go on. In case 0.5568 is broken, the price could continue its move toward 0.5598.
ดูเพิ่มเติม
- All
- All
- Bearish Rectangle
- Bearish Symmetrical Triangle
- Bearish Symmetrical Triangle
- Bullish Rectangle
- Double Top
- Double Top
- Triple Bottom
- Triple Bottom
- Triple Top
- Triple Top
- All
- All
- Buy
- Sale
- All
- 1
- 2
- 3
- 4
- 5
डबल टॉप
was formed on 31.03 at 10:30:55 (UTC+0)
signal strength 3 of 5
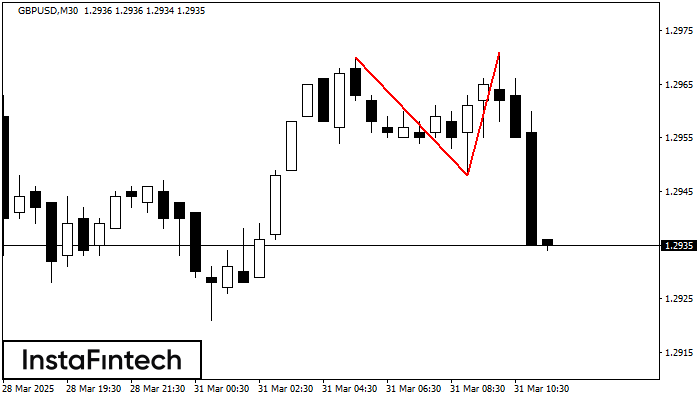
GBPUSD M30 पर डबल टॉप रीवर्सल पैटर्न बना है। विशेषताएं: ऊपरी सीमा 1.2970; निचली सीमा 1.2948; पैटर्न की चौड़ाई 23 पॉइंट्स है। सेल ट्रेडों को 1.2948 की निचली सीमा के
Open chart in a new window
ट्रिपल टॉप
was formed on 31.03 at 10:00:28 (UTC+0)
signal strength 3 of 5

EURUSD M30 ट्रेडिंग इंस्ट्रूमेंट के चार्ट पर, ट्रिपल टॉप पैटर्न जो एक प्रवृत्ति परिवर्तन का संकेत देता है, बना है। यह संभव है कि तीसरी चोटी के गठन के बाद
Open chart in a new window
डबल बॉटम
was formed on 31.03 at 10:00:26 (UTC+0)
signal strength 3 of 5

डबल बॉटम पैटर्न USDJPY M30 पर बना है। यह फॉर्मेशन नीचे से ऊपर की ओर प्रवृत्ति के उलट होने का संकेत देता है। संकेत यह है कि पैटर्न 149.26 की
Open chart in a new window


