

รูปแบบกราฟ

รูปแบบกราฟนั้นเป็น รูปจำลองทางกราฟฟิกที่ถูกสร้างขึ้นมาในชาร์ตจากราคา อ้างอิงตามหนึ่งในการวิเคราะห์ทางเทคนิค ที่ตั้งสมมติฐานมาว่า ประวัติศาสตร์ (การเคลื่อนไหวของราคา) มักจะเกิดขึ้นซ้ำรอยเดิม นั้นหมายความว่า การเคลื่อนไหวของราคาก็หมือนกับ สถานการณ์หนึ่งที่จะสามารถทำการคาดการณ์ไปยังทิศทางในอนาคต ตามเหตุการณ์ที่น่าจะมีความเป็นไปได้สูง
รูปแบบกราฟที่สำคัญจากทาง InstaTrade นั้นจะเป็นการบริการที่มีการใช้อย่างง่ายดาย ซึ่งจะช่วยให้คุณสามารถทราบถึงการเปลี่ยนแปลงล่าสุด ในตลาดได้ และสามารถรับมือกับข้อมูลจากทางตลาดได้ทันท่วงที ในการบริการของพวกเรานั้น คุณจะพบกับรูปแบบกราฟล่าสุดและมีความสำคัญมากที่สุดในทุกๆคู่สกุลเงิน และทุกๆขอบเขตเวลา
Bullish pennant
was formed on 27.03 at 17:50:18 (UTC+0)
signal strength 1 of 5
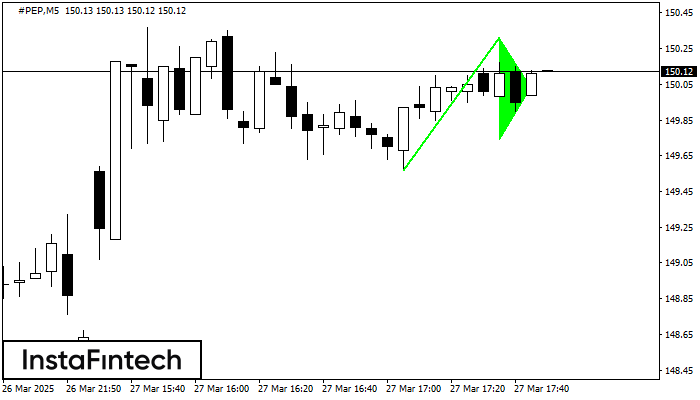
The Bullish pennant pattern is formed on the #PEP M5 chart. It is a type of the continuation pattern. Supposedly, in case the price is fixed above the pennant’s high of 150.31, a further uptrend is possible.
The M5 and M15 time frames may have more false entry points.
ดูเพิ่มเติม
- All
- All
- Bearish Rectangle
- Bearish Symmetrical Triangle
- Bearish Symmetrical Triangle
- Bullish Rectangle
- Double Top
- Double Top
- Triple Bottom
- Triple Bottom
- Triple Top
- Triple Top
- All
- All
- Buy
- Sale
- All
- 1
- 2
- 3
- 4
- 5
Triple Bottom
was formed on 02.04 at 12:00:59 (UTC+0)
signal strength 4 of 5
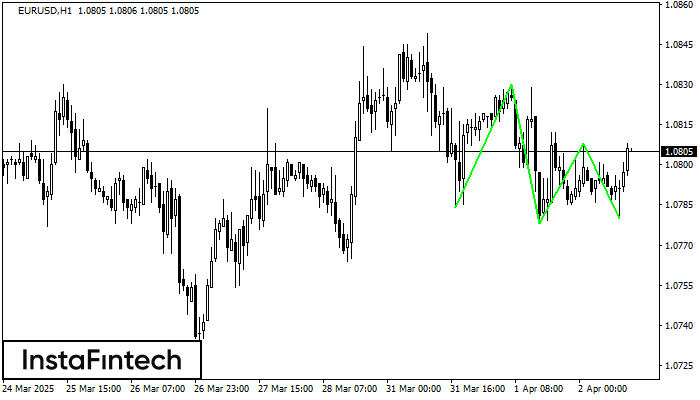
The Triple Bottom pattern has been formed on EURUSD H1. It has the following characteristics: resistance level 1.0830/1.0808; support level 1.0784/1.0780; the width is 46 points. In the event
Open chart in a new window
Double Bottom
was formed on 02.04 at 11:20:53 (UTC+0)
signal strength 1 of 5

The Double Bottom pattern has been formed on EURNZD M5. Characteristics: the support level 1.8799; the resistance level 1.8817; the width of the pattern 18 points. If the resistance level
The M5 and M15 time frames may have more false entry points.
Open chart in a new window
Inverse Head and Shoulder
was formed on 02.04 at 11:00:29 (UTC+0)
signal strength 4 of 5
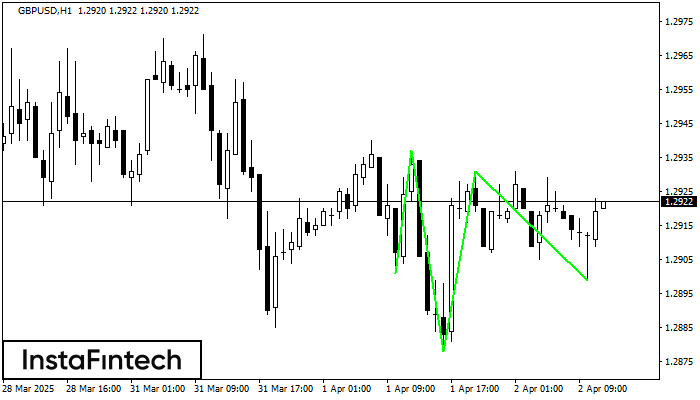
According to H1, GBPUSD is shaping the technical pattern – the Inverse Head and Shoulder. In case the Neckline 1.2937/1.2931 is broken out, the instrument is likely to move toward
Open chart in a new window


