

รูปแบบกราฟ

รูปแบบกราฟนั้นเป็น รูปจำลองทางกราฟฟิกที่ถูกสร้างขึ้นมาในชาร์ตจากราคา อ้างอิงตามหนึ่งในการวิเคราะห์ทางเทคนิค ที่ตั้งสมมติฐานมาว่า ประวัติศาสตร์ (การเคลื่อนไหวของราคา) มักจะเกิดขึ้นซ้ำรอยเดิม นั้นหมายความว่า การเคลื่อนไหวของราคาก็หมือนกับ สถานการณ์หนึ่งที่จะสามารถทำการคาดการณ์ไปยังทิศทางในอนาคต ตามเหตุการณ์ที่น่าจะมีความเป็นไปได้สูง
รูปแบบกราฟที่สำคัญจากทาง InstaTrade นั้นจะเป็นการบริการที่มีการใช้อย่างง่ายดาย ซึ่งจะช่วยให้คุณสามารถทราบถึงการเปลี่ยนแปลงล่าสุด ในตลาดได้ และสามารถรับมือกับข้อมูลจากทางตลาดได้ทันท่วงที ในการบริการของพวกเรานั้น คุณจะพบกับรูปแบบกราฟล่าสุดและมีความสำคัญมากที่สุดในทุกๆคู่สกุลเงิน และทุกๆขอบเขตเวลา
Bullish Rectangle
was formed on 26.03 at 13:25:38 (UTC+0)
signal strength 1 of 5
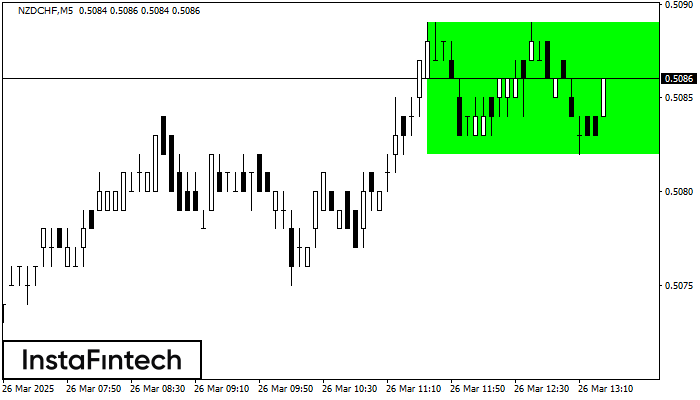
According to the chart of M5, NZDCHF formed the Bullish Rectangle. This type of a pattern indicates a trend continuation. It consists of two levels: resistance 0.5089 and support 0.5082. In case the resistance level 0.5089 - 0.5089 is broken, the instrument is likely to follow the bullish trend.
The M5 and M15 time frames may have more false entry points.
ดูเพิ่มเติม
- All
- All
- Bearish Rectangle
- Bearish Symmetrical Triangle
- Bearish Symmetrical Triangle
- Bullish Rectangle
- Double Top
- Double Top
- Triple Bottom
- Triple Bottom
- Triple Top
- Triple Top
- All
- All
- Buy
- Sale
- All
- 1
- 2
- 3
- 4
- 5
รูปแบบกราฟธงขาลง (Bearish Flag)
was formed on 01.04 at 12:50:23 (UTC+0)
signal strength 1 of 5

รูปแบบ รูปแบบกราฟธงขาลง (Bearish Flag) ได้สร้างขึ้นมาในชาร์ต USDCHF M5 ดังนั้นแนวโน้มขาลงอาจจะยังคงเกิดขึ้นในระยะเวลาอันสั้นนี้ จนกว่าราคาเคลื่อนตัวทะลุผ่านต่ำกว่าระดับต่ำที่ 0.8817 เทรดเดอร์ควรจะเข้าไปยังตลาด
ขอบเตระยะเวลาใน M5 และ M15 อาจจะมีตำแหน่งการเข้าใช้งานที่ผิดพลาดมากยิ่งขึ้น
Open chart in a new window
รูปแบบกราฟธงปลายแหลมขาลง (Bearish pennant)
was formed on 01.04 at 12:50:18 (UTC+0)
signal strength 1 of 5
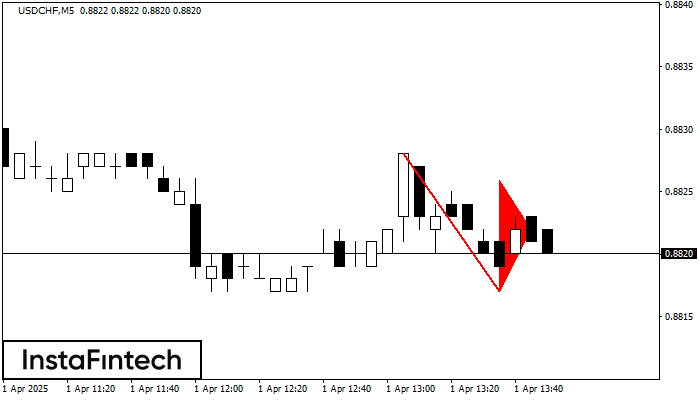
รูปแบบ รูปแบบกราฟธงปลายแหลมขาลง (Bearish pennant) ได้สร้างขึ้นมาในชาร์ต USDCHF M5 มันแสดงถึงความต่อเนื่องของแนวโน้มปัจจุบัน คุณลักษณะจำเพาะ: ระดับต่ำของรูปแบบนี้จะเป็นพิกัดของ 0.8817;การประมาณการความสูงของตัวเสาธง เท่ากับ 11 บี๊ป ในกรณีที่ราคาเคลื่อนตัวทะลุผ่านระดับต่ำของรูปแบบนี้ที่
ขอบเตระยะเวลาใน M5 และ M15 อาจจะมีตำแหน่งการเข้าใช้งานที่ผิดพลาดมากยิ่งขึ้น
Open chart in a new window
รูปแบบสามเหลี่ยมสมมาตรขาขึ้น (Bullish Symmetrical Triangle)
was formed on 01.04 at 11:03:47 (UTC+0)
signal strength 3 of 5

อ้างอิงจากชาร์ตของ M30, GBPUSD ที่ได้สร้างรูปแบบ รูปแบบสามเหลี่ยมสมมาตรขาขึ้น (Bullish Symmetrical Triangle) ออกมา ขอบเขตด้านล่างของรูปแบบสัมผัสพิกัด 1.2876/1.2915 แม้ว่าขอบเขตด้านบนจะข้ามผ่าน 1.2971/1.2915 ถ้ารูปแบบ รูปแบบสามเหลี่ยมสมมาตรขาขึ้น
Open chart in a new window


