

รูปแบบกราฟ

รูปแบบกราฟนั้นเป็น รูปจำลองทางกราฟฟิกที่ถูกสร้างขึ้นมาในชาร์ตจากราคา อ้างอิงตามหนึ่งในการวิเคราะห์ทางเทคนิค ที่ตั้งสมมติฐานมาว่า ประวัติศาสตร์ (การเคลื่อนไหวของราคา) มักจะเกิดขึ้นซ้ำรอยเดิม นั้นหมายความว่า การเคลื่อนไหวของราคาก็หมือนกับ สถานการณ์หนึ่งที่จะสามารถทำการคาดการณ์ไปยังทิศทางในอนาคต ตามเหตุการณ์ที่น่าจะมีความเป็นไปได้สูง
รูปแบบกราฟที่สำคัญจากทาง InstaTrade นั้นจะเป็นการบริการที่มีการใช้อย่างง่ายดาย ซึ่งจะช่วยให้คุณสามารถทราบถึงการเปลี่ยนแปลงล่าสุด ในตลาดได้ และสามารถรับมือกับข้อมูลจากทางตลาดได้ทันท่วงที ในการบริการของพวกเรานั้น คุณจะพบกับรูปแบบกราฟล่าสุดและมีความสำคัญมากที่สุดในทุกๆคู่สกุลเงิน และทุกๆขอบเขตเวลา
Triple Top
was formed on 25.03 at 12:40:11 (UTC+0)
signal strength 1 of 5
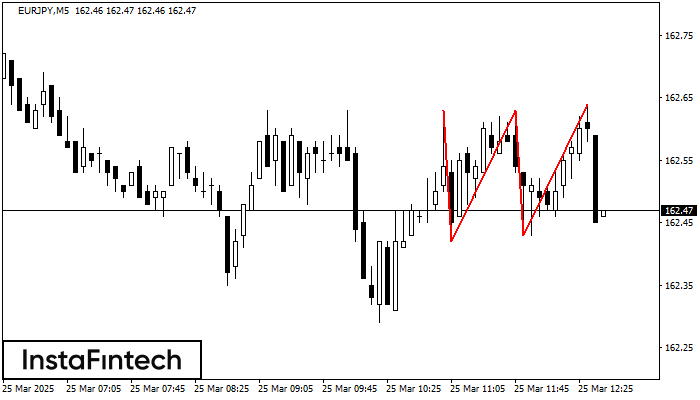
On the chart of the EURJPY M5 trading instrument, the Triple Top pattern that signals a trend change has formed. It is possible that after formation of the third peak, the price will try to break through the resistance level 162.42, where we advise to open a trading position for sale. Take profit is the projection of the pattern’s width, which is 21 points.
The M5 and M15 time frames may have more false entry points.
- All
- All
- Bearish Rectangle
- Bearish Symmetrical Triangle
- Bearish Symmetrical Triangle
- Bullish Rectangle
- Double Top
- Double Top
- Triple Bottom
- Triple Bottom
- Triple Top
- Triple Top
- All
- All
- Buy
- Sale
- All
- 1
- 2
- 3
- 4
- 5
Double Top
was formed on 28.03 at 11:04:46 (UTC+0)
signal strength 1 of 5
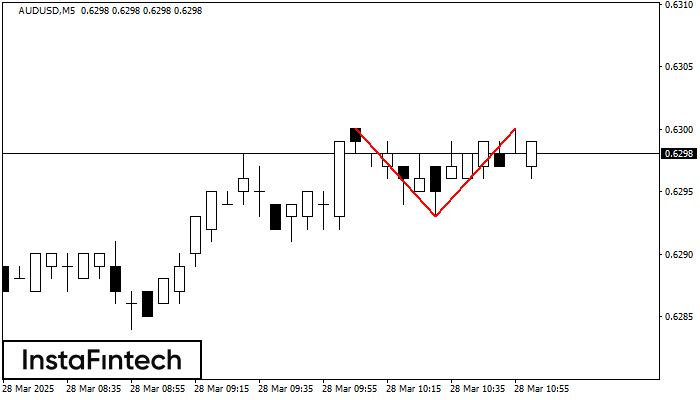
The Double Top pattern has been formed on AUDUSD M5. It signals that the trend has been changed from upwards to downwards. Probably, if the base of the pattern 0.6293
The M5 and M15 time frames may have more false entry points.
Open chart in a new window
Double Top
was formed on 28.03 at 10:30:00 (UTC+0)
signal strength 3 of 5
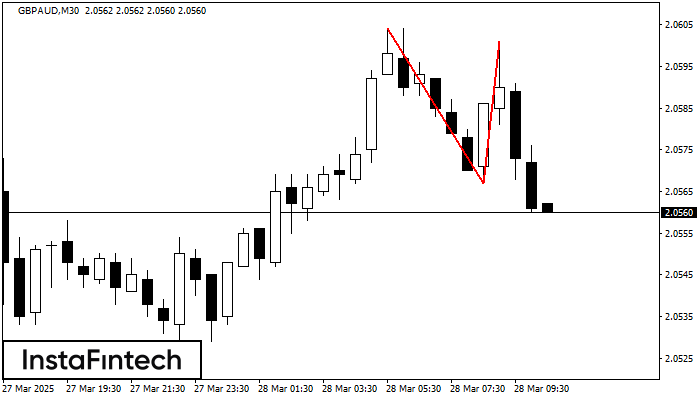
On the chart of GBPAUD M30 the Double Top reversal pattern has been formed. Characteristics: the upper boundary 2.0601; the lower boundary 2.0567; the width of the pattern 34 points
Open chart in a new window
Double Top
was formed on 28.03 at 10:10:18 (UTC+0)
signal strength 1 of 5
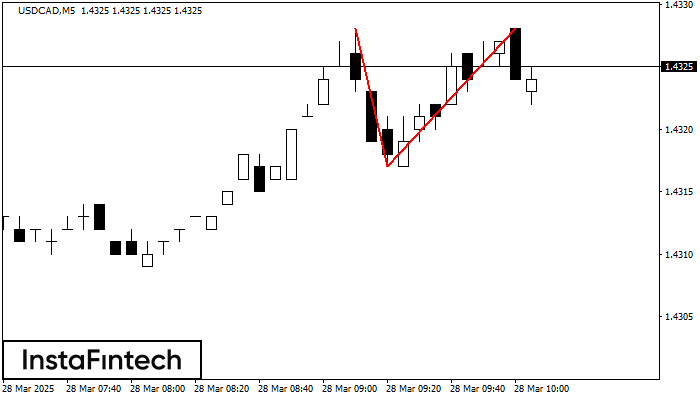
The Double Top reversal pattern has been formed on USDCAD M5. Characteristics: the upper boundary 1.4328; the lower boundary 1.4317; the width of the pattern is 11 points. Sell trades
The M5 and M15 time frames may have more false entry points.
Open chart in a new window


