

รูปแบบกราฟ

รูปแบบกราฟนั้นเป็น รูปจำลองทางกราฟฟิกที่ถูกสร้างขึ้นมาในชาร์ตจากราคา อ้างอิงตามหนึ่งในการวิเคราะห์ทางเทคนิค ที่ตั้งสมมติฐานมาว่า ประวัติศาสตร์ (การเคลื่อนไหวของราคา) มักจะเกิดขึ้นซ้ำรอยเดิม นั้นหมายความว่า การเคลื่อนไหวของราคาก็หมือนกับ สถานการณ์หนึ่งที่จะสามารถทำการคาดการณ์ไปยังทิศทางในอนาคต ตามเหตุการณ์ที่น่าจะมีความเป็นไปได้สูง
รูปแบบกราฟที่สำคัญจากทาง InstaTrade นั้นจะเป็นการบริการที่มีการใช้อย่างง่ายดาย ซึ่งจะช่วยให้คุณสามารถทราบถึงการเปลี่ยนแปลงล่าสุด ในตลาดได้ และสามารถรับมือกับข้อมูลจากทางตลาดได้ทันท่วงที ในการบริการของพวกเรานั้น คุณจะพบกับรูปแบบกราฟล่าสุดและมีความสำคัญมากที่สุดในทุกๆคู่สกุลเงิน และทุกๆขอบเขตเวลา
Double Bottom
was formed on 24.03 at 10:46:05 (UTC+0)
signal strength 2 of 5
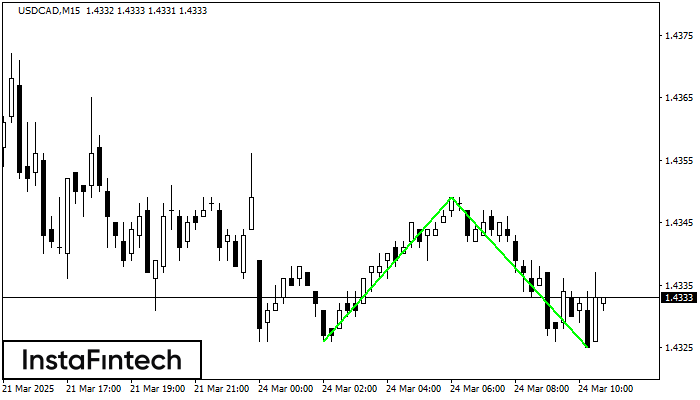
The Double Bottom pattern has been formed on USDCAD M15; the upper boundary is 1.4349; the lower boundary is 1.4325. The width of the pattern is 23 points. In case of a break of the upper boundary 1.4349, a change in the trend can be predicted where the width of the pattern will coincide with the distance to a possible take profit level.
The M5 and M15 time frames may have more false entry points.
- All
- All
- Bearish Rectangle
- Bearish Symmetrical Triangle
- Bearish Symmetrical Triangle
- Bullish Rectangle
- Double Top
- Double Top
- Triple Bottom
- Triple Bottom
- Triple Top
- Triple Top
- All
- All
- Buy
- Sale
- All
- 1
- 2
- 3
- 4
- 5
বিয়ারিশ ফ্ল্যাগ
was formed on 01.04 at 12:50:23 (UTC+0)
signal strength 1 of 5

M5 চার্টে USDCHF-এর বিয়ারিশ ফ্ল্যাগ প্যাটার্ন গঠিত হয়েছে। অতএব, নিকটতম মেয়াদে নিম্নমুখী প্রবণতা অব্যাহত থাকার সম্ভাবনা রয়েছে। যখনই মূল্য 0.8817-এর সর্বনিম্ন স্তরের নীচে ব্রেক করবে, ট্রেডারদের বাজারে প্রবেশ করা উচিত।
M5 এবং M15 টাইম ফ্রেমে আরও ভুল এন্ট্রি পয়েন্ট থাকতে পারে।
Open chart in a new window
বিয়ারিশ পেন্যান্ট
was formed on 01.04 at 12:50:18 (UTC+0)
signal strength 1 of 5
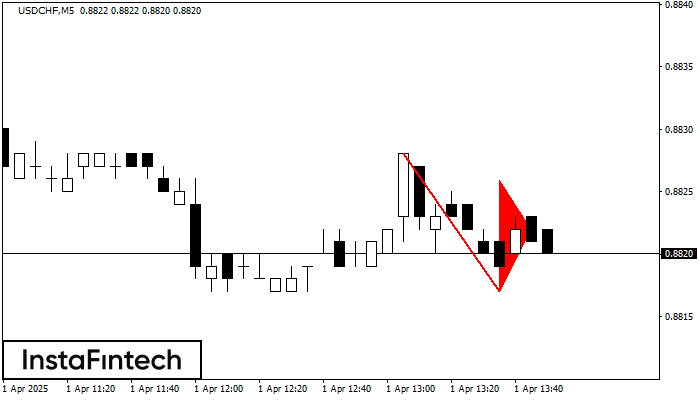
M5 চার্টে USDCHF-এর বিয়ারিশ পেন্যান্ট প্যাটার্ন গঠিত হয়েছে৷ এটি বিদ্যমান প্রবণতার সম্ভাব্য ধারাবাহিকতার ইঙ্গিত দেয়। স্পেসিফিকেশন: প্যাটার্নের নীচে 0.8817 কোঅর্ডিনেশন রয়েছে; ফ্ল্যাগপোলের উচ্চতার প্রজেকশন 11 পিপসের সমান। যদি এই প্যাটার্নের
M5 এবং M15 টাইম ফ্রেমে আরও ভুল এন্ট্রি পয়েন্ট থাকতে পারে।
Open chart in a new window
বুলিশ সিমেট্রিকাল ট্রায়াঙ্গেল
was formed on 01.04 at 11:03:47 (UTC+0)
signal strength 3 of 5

M30 চার্ট অনুযায়ী, GBPUSD বুলিশ সিমেট্রিকাল ট্রায়াঙ্গেল প্যাটার্ন গঠন করেছে। প্যাটার্নের নীচের সীমানা 1.2876/1.2915-এর কোঅর্ডিনেটগুলো স্পর্শ করেছে যেখানে উপরের সীমানাটি 1.2971/1.2915 জুড়ে যাচ্ছে৷ যদি বুলিশ সিমেট্রিকাল ট্রায়াঙ্গেল প্যাটার্নটি বজায় থাকে
Open chart in a new window


