

รูปแบบกราฟ

รูปแบบกราฟนั้นเป็น รูปจำลองทางกราฟฟิกที่ถูกสร้างขึ้นมาในชาร์ตจากราคา อ้างอิงตามหนึ่งในการวิเคราะห์ทางเทคนิค ที่ตั้งสมมติฐานมาว่า ประวัติศาสตร์ (การเคลื่อนไหวของราคา) มักจะเกิดขึ้นซ้ำรอยเดิม นั้นหมายความว่า การเคลื่อนไหวของราคาก็หมือนกับ สถานการณ์หนึ่งที่จะสามารถทำการคาดการณ์ไปยังทิศทางในอนาคต ตามเหตุการณ์ที่น่าจะมีความเป็นไปได้สูง
รูปแบบกราฟที่สำคัญจากทาง InstaTrade นั้นจะเป็นการบริการที่มีการใช้อย่างง่ายดาย ซึ่งจะช่วยให้คุณสามารถทราบถึงการเปลี่ยนแปลงล่าสุด ในตลาดได้ และสามารถรับมือกับข้อมูลจากทางตลาดได้ทันท่วงที ในการบริการของพวกเรานั้น คุณจะพบกับรูปแบบกราฟล่าสุดและมีความสำคัญมากที่สุดในทุกๆคู่สกุลเงิน และทุกๆขอบเขตเวลา
Bullish Symmetrical Triangle
was formed on 21.03 at 02:01:15 (UTC+0)
signal strength 2 of 5
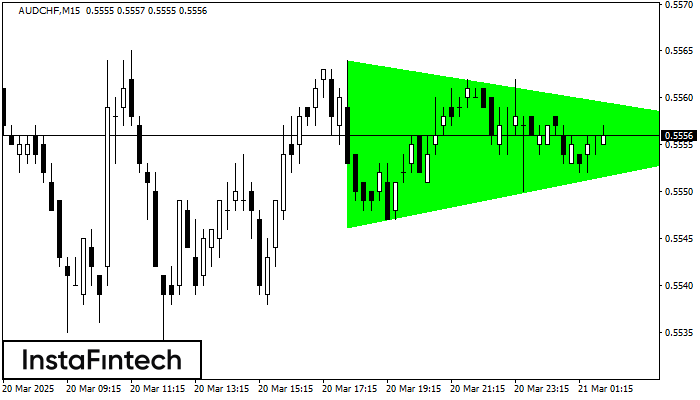
According to the chart of M15, AUDCHF formed the Bullish Symmetrical Triangle pattern, which signals the trend will continue. Description. The upper border of the pattern touches the coordinates 0.5564/0.5556 whereas the lower border goes across 0.5546/0.5556. The pattern width is measured on the chart at 18 pips. If the Bullish Symmetrical Triangle pattern is in progress during the upward trend, this indicates the current trend will go on. In case 0.5556 is broken, the price could continue its move toward 0.5579.
The M5 and M15 time frames may have more false entry points.
- All
- All
- Bearish Rectangle
- Bearish Symmetrical Triangle
- Bearish Symmetrical Triangle
- Bullish Rectangle
- Double Top
- Double Top
- Triple Bottom
- Triple Bottom
- Triple Top
- Triple Top
- All
- All
- Buy
- Sale
- All
- 1
- 2
- 3
- 4
- 5
รูปแบบกราฟหัวและหัวไหล่แบบกลับหัว (Inverse Head and Shoulder)
was formed on 28.03 at 11:39:48 (UTC+0)
signal strength 1 of 5
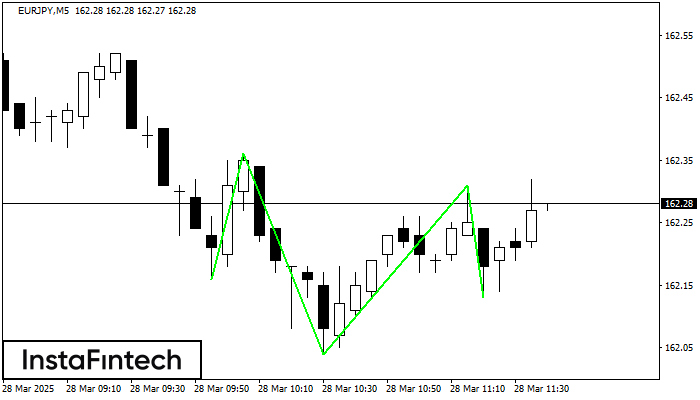
อ้างอิงจาก M5, EURJPY กำลังก่อรูปแบบทางเทคนิคขึ้นมา รูปแบบกราฟหัวและหัวไหล่แบบกลับหัว (Inverse Head and Shoulder) ในกรณีที่มีการเคลื่อนตัวทะลุผ่านตำแหน่งคอ 162.36/162.31 ออกไป ตราสารก็อาจจะเคลื่อนตัวไปยัง 162.46
ขอบเตระยะเวลาใน M5 และ M15 อาจจะมีตำแหน่งการเข้าใช้งานที่ผิดพลาดมากยิ่งขึ้น
Open chart in a new window
รูปแบบกราฟจุดสองยอด (Double Top)
was formed on 28.03 at 11:04:46 (UTC+0)
signal strength 1 of 5
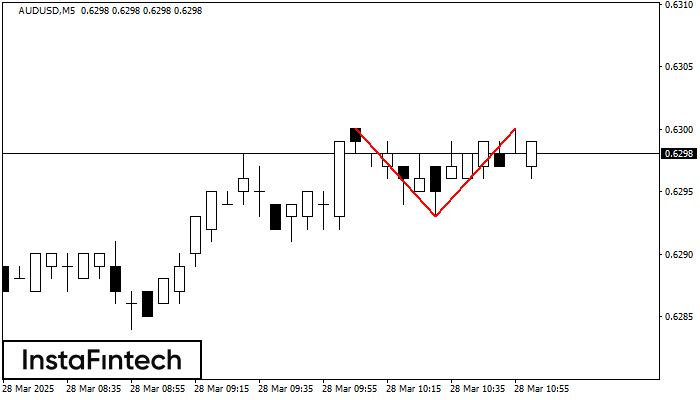
รูปแบบ รูปแบบกราฟจุดสองยอด (Double Top) ถูกสร้างขึ้นมาใน AUDUSD M5 มันแสดงให้เห็นว่า แนวโน้มได้มีการเปลี่ยนแปลงจากแนวโน้มขาขึ้น ไปเป็นขาลง บางที ถ้ามีการเคลื่อนตัวทะลุผ่าน ฐานของรูปแบบออกไป 0.6293 การเคลื่อนไหวลงด้านล่างจะยังคงเกิดขึ้น
ขอบเตระยะเวลาใน M5 และ M15 อาจจะมีตำแหน่งการเข้าใช้งานที่ผิดพลาดมากยิ่งขึ้น
Open chart in a new window
รูปแบบกราฟจุดสองยอด (Double Top)
was formed on 28.03 at 10:30:00 (UTC+0)
signal strength 3 of 5
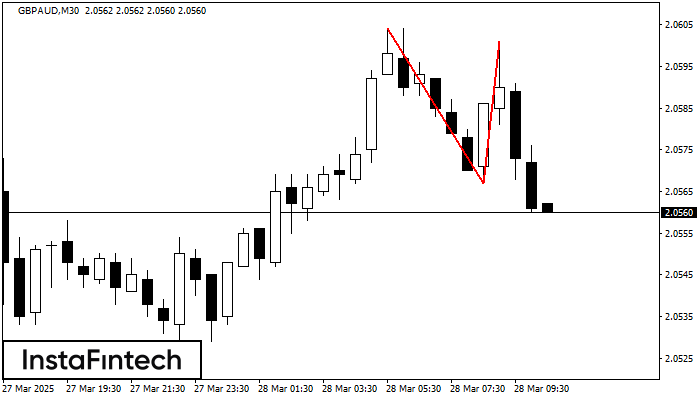
ในชาร์ตของ GBPAUD M30 พบว่า กราฟรูปแบบย้อนกลับ รูปแบบกราฟจุดสองยอด (Double Top) ได้ถูกสร้างขึ้นมา คุณลักษณะ: ขอบเขตด้านบน 2.0601; ขอบเขตด้านล่าง 2.0567; ความกว้างของกราฟรูปแบบนี้คือ
Open chart in a new window


