

รูปแบบกราฟ

รูปแบบกราฟนั้นเป็น รูปจำลองทางกราฟฟิกที่ถูกสร้างขึ้นมาในชาร์ตจากราคา อ้างอิงตามหนึ่งในการวิเคราะห์ทางเทคนิค ที่ตั้งสมมติฐานมาว่า ประวัติศาสตร์ (การเคลื่อนไหวของราคา) มักจะเกิดขึ้นซ้ำรอยเดิม นั้นหมายความว่า การเคลื่อนไหวของราคาก็หมือนกับ สถานการณ์หนึ่งที่จะสามารถทำการคาดการณ์ไปยังทิศทางในอนาคต ตามเหตุการณ์ที่น่าจะมีความเป็นไปได้สูง
รูปแบบกราฟที่สำคัญจากทาง InstaTrade นั้นจะเป็นการบริการที่มีการใช้อย่างง่ายดาย ซึ่งจะช่วยให้คุณสามารถทราบถึงการเปลี่ยนแปลงล่าสุด ในตลาดได้ และสามารถรับมือกับข้อมูลจากทางตลาดได้ทันท่วงที ในการบริการของพวกเรานั้น คุณจะพบกับรูปแบบกราฟล่าสุดและมีความสำคัญมากที่สุดในทุกๆคู่สกุลเงิน และทุกๆขอบเขตเวลา
Head and Shoulders
was formed on 18.03 at 05:16:03 (UTC+0)
signal strength 1 of 5
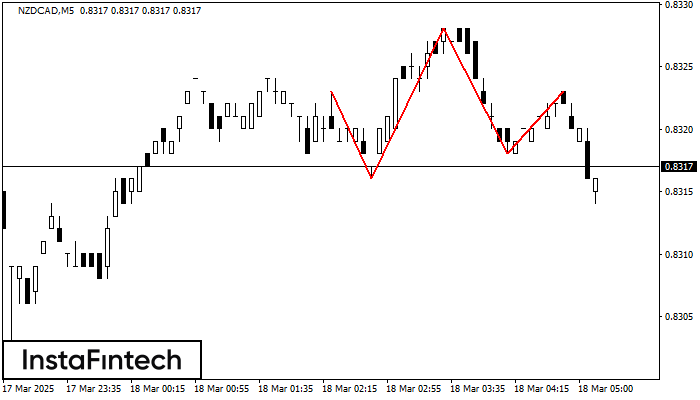
The NZDCAD M5 formed the Head and Shoulders pattern with the following features: The Head’s top is at 0.8328, the Neckline and the upward angle are at 0.8316/0.8318. The formation of this pattern can bring about changes in the current trend from bullish to bearish. In case the pattern triggers the expected changes, the price of NZDCAD will go towards 0.8303.
The M5 and M15 time frames may have more false entry points.
ดูเพิ่มเติม
- All
- All
- Bearish Rectangle
- Bearish Symmetrical Triangle
- Bearish Symmetrical Triangle
- Bullish Rectangle
- Double Top
- Double Top
- Triple Bottom
- Triple Bottom
- Triple Top
- Triple Top
- All
- All
- Buy
- Sale
- All
- 1
- 2
- 3
- 4
- 5
รูปแบบกราฟธงปลายแหลมขาลง (Bearish pennant)
was formed on 18.03 at 18:47:11 (UTC+0)
signal strength 2 of 5
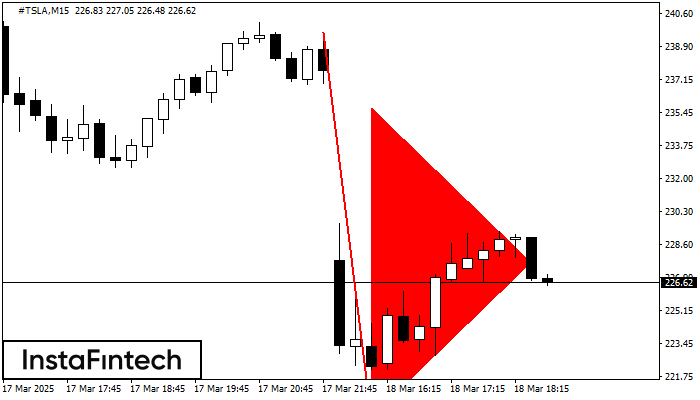
รูปแบบ รูปแบบกราฟธงปลายแหลมขาลง (Bearish pennant) ได้สร้างขึ้นมาในชาร์ต #TSLA M15 รูปแบบประเภทนี้จัดว่าเป็นการชะลอตัวลงเล็กน้อย หลังจากที่ราคาจะเคลื่อนตัว ไปในทิศทางของแนวโน้มเดิม กรณีที่ราคาทรงตัวอยู่ต่ำกว่าระดับต่ำของรูปแบบใน 219.61 เทรดเดอร์ก็จะสามารถเข้าไปถึงสถานะการขายได้สำเร็จ
ขอบเตระยะเวลาใน M5 และ M15 อาจจะมีตำแหน่งการเข้าใช้งานที่ผิดพลาดมากยิ่งขึ้น
Open chart in a new window
รูปแบบกราฟธงปลายแหลมขาลง (Bearish pennant)
was formed on 18.03 at 18:47:10 (UTC+0)
signal strength 2 of 5

รูปแบบ รูปแบบกราฟธงปลายแหลมขาลง (Bearish pennant) ได้สร้างขึ้นมาในชาร์ต #TSLA M15 มันแสดงถึงความต่อเนื่องของแนวโน้มปัจจุบัน คุณลักษณะจำเพาะ: ระดับต่ำของรูปแบบนี้จะเป็นพิกัดของ 219.61;การประมาณการความสูงของตัวเสาธง เท่ากับ 2002 บี๊ป ในกรณีที่ราคาเคลื่อนตัวทะลุผ่านระดับต่ำของรูปแบบนี้ที่
ขอบเตระยะเวลาใน M5 และ M15 อาจจะมีตำแหน่งการเข้าใช้งานที่ผิดพลาดมากยิ่งขึ้น
Open chart in a new window
รูปแบบกราฟจุดสามยอดขาลง (Triple Bottom)
was formed on 18.03 at 18:15:41 (UTC+0)
signal strength 1 of 5
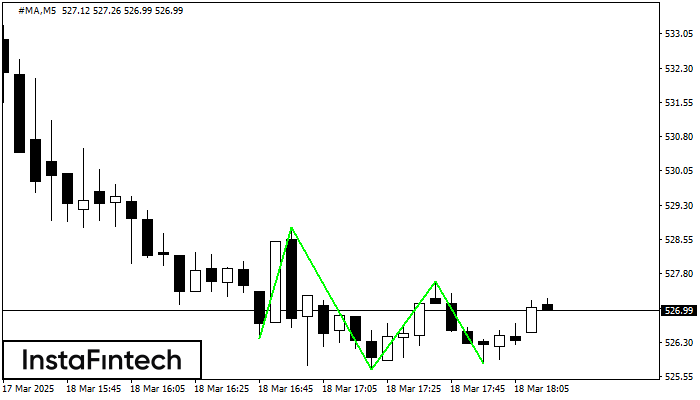
รูปแบบ รูปแบบกราฟจุดสามยอดขาลง (Triple Bottom) ได้สร้างขึ้นมาในชาร์ตของ #MA M5 ที่เป็นตราสารการซื้อขาย รูปแบบนี้แสดงถึงการเปลี่่ยนแปลงในแนวโน้มจากแนวโน้มขาลง ไปเป็นแนวโน้มขาขึ้น ในกรณีที่มีการเคลื่อนตัวทะลุผ่านที่ 528.82/527.64
ขอบเตระยะเวลาใน M5 และ M15 อาจจะมีตำแหน่งการเข้าใช้งานที่ผิดพลาดมากยิ่งขึ้น
Open chart in a new window


