

รูปแบบกราฟ

รูปแบบกราฟนั้นเป็น รูปจำลองทางกราฟฟิกที่ถูกสร้างขึ้นมาในชาร์ตจากราคา อ้างอิงตามหนึ่งในการวิเคราะห์ทางเทคนิค ที่ตั้งสมมติฐานมาว่า ประวัติศาสตร์ (การเคลื่อนไหวของราคา) มักจะเกิดขึ้นซ้ำรอยเดิม นั้นหมายความว่า การเคลื่อนไหวของราคาก็หมือนกับ สถานการณ์หนึ่งที่จะสามารถทำการคาดการณ์ไปยังทิศทางในอนาคต ตามเหตุการณ์ที่น่าจะมีความเป็นไปได้สูง
รูปแบบกราฟที่สำคัญจากทาง InstaTrade นั้นจะเป็นการบริการที่มีการใช้อย่างง่ายดาย ซึ่งจะช่วยให้คุณสามารถทราบถึงการเปลี่ยนแปลงล่าสุด ในตลาดได้ และสามารถรับมือกับข้อมูลจากทางตลาดได้ทันท่วงที ในการบริการของพวกเรานั้น คุณจะพบกับรูปแบบกราฟล่าสุดและมีความสำคัญมากที่สุดในทุกๆคู่สกุลเงิน และทุกๆขอบเขตเวลา
Triple Top
was formed on 18.03 at 04:30:36 (UTC+0)
signal strength 2 of 5
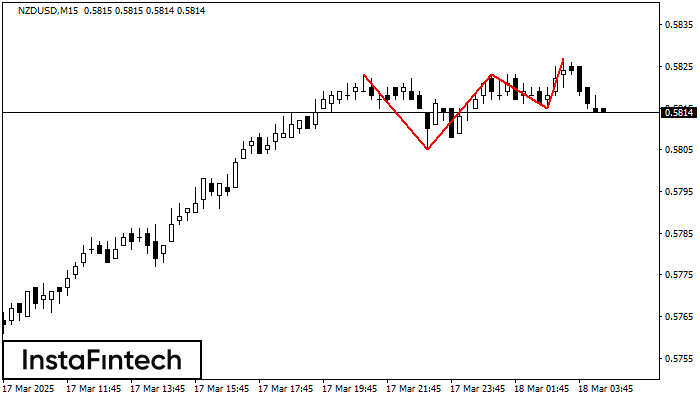
On the chart of the NZDUSD M15 trading instrument, the Triple Top pattern that signals a trend change has formed. It is possible that after formation of the third peak, the price will try to break through the resistance level 0.5805, where we advise to open a trading position for sale. Take profit is the projection of the pattern’s width, which is 18 points.
The M5 and M15 time frames may have more false entry points.
ดูเพิ่มเติม
- All
- All
- Bearish Rectangle
- Bearish Symmetrical Triangle
- Bearish Symmetrical Triangle
- Bullish Rectangle
- Double Top
- Double Top
- Triple Bottom
- Triple Bottom
- Triple Top
- Triple Top
- All
- All
- Buy
- Sale
- All
- 1
- 2
- 3
- 4
- 5
Head and Shoulders
was formed on 18.03 at 15:45:00 (UTC+0)
signal strength 2 of 5
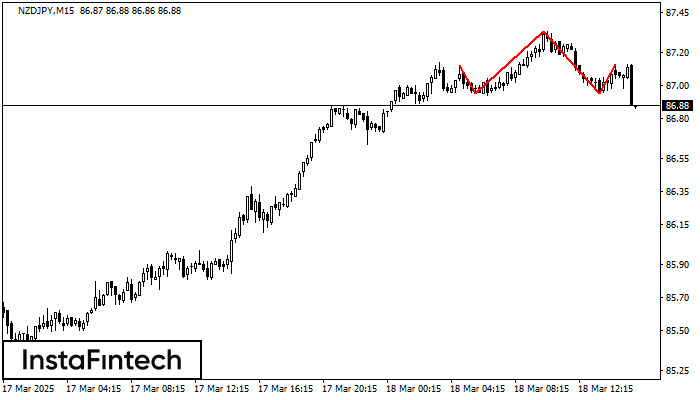
According to the chart of M15, NZDJPY formed the Head and Shoulders pattern. The Head’s top is set at 87.33 while the median line of the Neck is found
The M5 and M15 time frames may have more false entry points.
Open chart in a new window
Triple Top
was formed on 18.03 at 15:44:58 (UTC+0)
signal strength 2 of 5
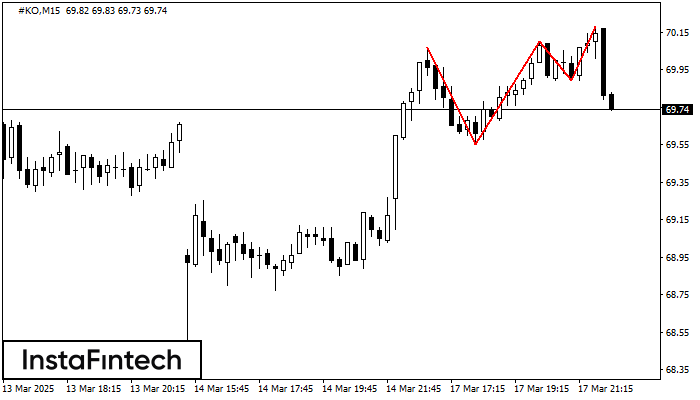
The Triple Top pattern has formed on the chart of the #KO M15. Features of the pattern: borders have an ascending angle; the lower line of the pattern
The M5 and M15 time frames may have more false entry points.
Open chart in a new window
Bullish Symmetrical Triangle
was formed on 18.03 at 15:44:52 (UTC+0)
signal strength 1 of 5
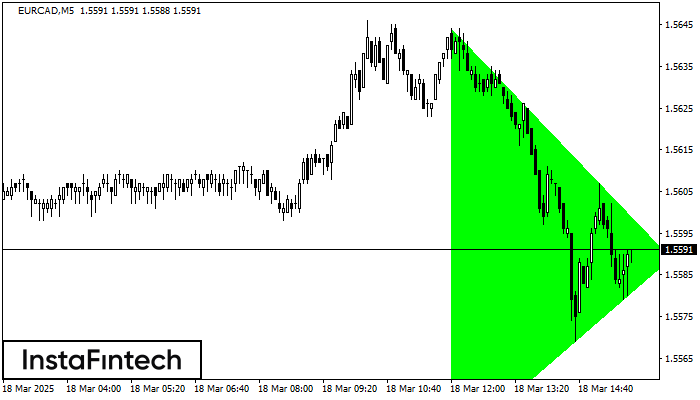
According to the chart of M5, EURCAD formed the Bullish Symmetrical Triangle pattern. Description: This is the pattern of a trend continuation. 1.5644 and 1.5543 are the coordinates
The M5 and M15 time frames may have more false entry points.
Open chart in a new window


