

รูปแบบกราฟ

รูปแบบกราฟนั้นเป็น รูปจำลองทางกราฟฟิกที่ถูกสร้างขึ้นมาในชาร์ตจากราคา อ้างอิงตามหนึ่งในการวิเคราะห์ทางเทคนิค ที่ตั้งสมมติฐานมาว่า ประวัติศาสตร์ (การเคลื่อนไหวของราคา) มักจะเกิดขึ้นซ้ำรอยเดิม นั้นหมายความว่า การเคลื่อนไหวของราคาก็หมือนกับ สถานการณ์หนึ่งที่จะสามารถทำการคาดการณ์ไปยังทิศทางในอนาคต ตามเหตุการณ์ที่น่าจะมีความเป็นไปได้สูง
รูปแบบกราฟที่สำคัญจากทาง InstaTrade นั้นจะเป็นการบริการที่มีการใช้อย่างง่ายดาย ซึ่งจะช่วยให้คุณสามารถทราบถึงการเปลี่ยนแปลงล่าสุด ในตลาดได้ และสามารถรับมือกับข้อมูลจากทางตลาดได้ทันท่วงที ในการบริการของพวกเรานั้น คุณจะพบกับรูปแบบกราฟล่าสุดและมีความสำคัญมากที่สุดในทุกๆคู่สกุลเงิน และทุกๆขอบเขตเวลา
Bullish Rectangle
was formed on 17.03 at 19:24:15 (UTC+0)
signal strength 3 of 5
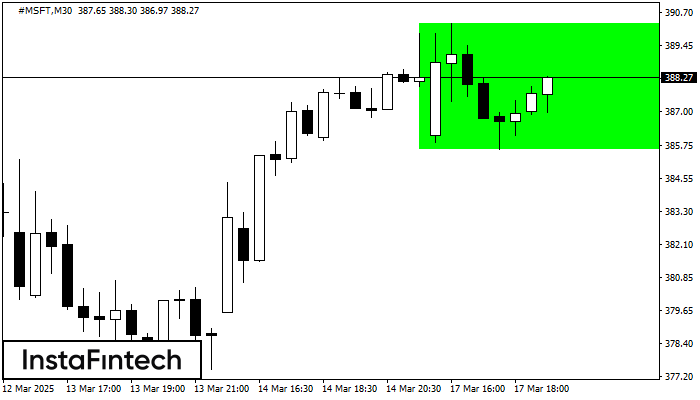
According to the chart of M30, #MSFT formed the Bullish Rectangle. This type of a pattern indicates a trend continuation. It consists of two levels: resistance 390.29 and support 385.61. In case the resistance level 390.29 - 390.29 is broken, the instrument is likely to follow the bullish trend.
ดูเพิ่มเติม
- All
- All
- Bearish Rectangle
- Bearish Symmetrical Triangle
- Bearish Symmetrical Triangle
- Bullish Rectangle
- Double Top
- Double Top
- Triple Bottom
- Triple Bottom
- Triple Top
- Triple Top
- All
- All
- Buy
- Sale
- All
- 1
- 2
- 3
- 4
- 5
รูปแบบกราฟจุดสามยอด (Triple Top)
was formed on 18.03 at 12:46:35 (UTC+0)
signal strength 1 of 5
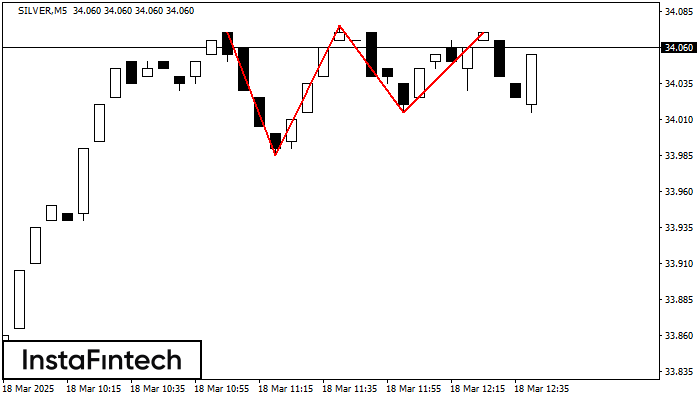
รูปแบบ รูปแบบกราฟจุดสามยอด (Triple Top) ได้สร้างขึ้นมาในชาร์ตของ SILVER M5 ที่เป็นตราสารการซื้อขาย มันเป็นกราฟรูปแบบกราฟรูปแบบย้อนกลับ ที่มีคุณลักษณะดังต่อไปนี้ : ระดับของแนวต้าน 0, ระดับของแนวรับ -30
ขอบเตระยะเวลาใน M5 และ M15 อาจจะมีตำแหน่งการเข้าใช้งานที่ผิดพลาดมากยิ่งขึ้น
Open chart in a new window
รูปแบบกราฟจุดสามยอด (Triple Top)
was formed on 18.03 at 12:30:10 (UTC+0)
signal strength 3 of 5
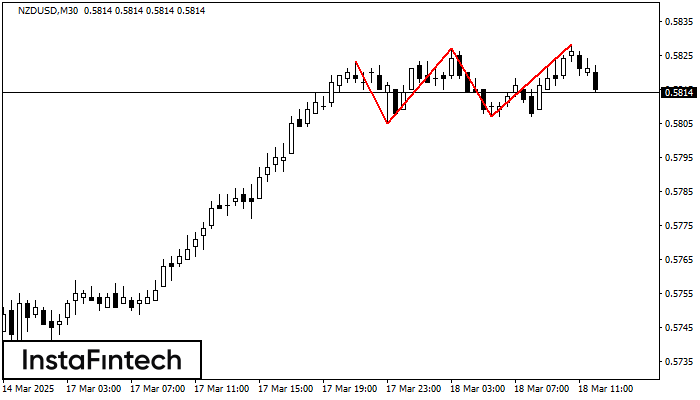
รูปแบบ รูปแบบกราฟจุดสามยอด (Triple Top) ได้สร้างขึ้นมาในชาร์ตของ NZDUSD M30 คุณลักษณะของกราฟรูปแบบนี้: ขอบเขตมีมุมหงายขึ้น; เส้นด้านล่างของกราฟรูปแบบนี้มีพิกัดอยู่ที่ 0.5805/0.5807 พร้อมกับลิมิตขาขึ้น 0.5823/0.5828; ระยะของความกว้างคือ
Open chart in a new window
รูปแบบกราฟจุดสองยอด (Double Top)
was formed on 18.03 at 12:15:12 (UTC+0)
signal strength 1 of 5
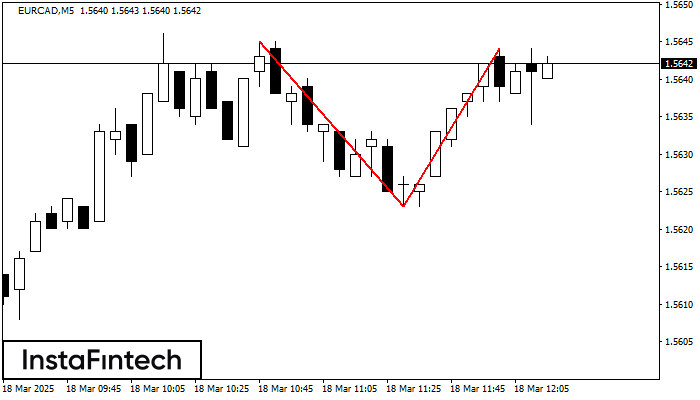
รูปแบบการย้อนตัว รูปแบบกราฟจุดสองยอด (Double Top) ได้ถูกสร้างขึ้นมาใน EURCAD M5 คุณลักษณะ: ขอบเขตด้านบน 1.5645; ขอบเขตด้านล่าง 1.5623; ความกว้างของกราฟรูปแบบนี้คือ 21 จุด
ขอบเตระยะเวลาใน M5 และ M15 อาจจะมีตำแหน่งการเข้าใช้งานที่ผิดพลาดมากยิ่งขึ้น
Open chart in a new window


