See also


The Pennant pattern is a well-known pattern that is widely used in technical analysis. This figure is regularly found on trading charts of almost all currency pairs.
The development of Pennant on the trading chart indicate continuation of the trend.
The Pennant pattern is a well-known pattern that is widely used in technical analysis. This figure is regularly found on trading charts of almost all currency pairs.
The Pennant pattern can be both bullish and bearish. For a bullish pennant, a flagpole is directed upwards with a pennant at the highest point. A bearish pennant has a flagpole directed downwards with the formation of an angle at the lowest point of the trend.
The Pennant pattern starts with a flagpole in the form of a series of candles that go in the same direction. This can be a trend or a simple price impulse. Further close monitoring of the market immediately after reaching the lowest point of the bearish trend (the highest point of the bullish trend) allows us to determine the formation of the final part of the pattern - a symmetrical triangle. Note that the Pennant pattern is forming relatively quickly. At the moment when the two lines passing through the highs and lows quite sharply converge towards each other, forming a small triangle, we can safely say about the formation of the Pennant.
The proper time for entering the market is the moment when the price breaks through the Pennant line that forms a triangle in the direction of its main trend relative to the flagpole.
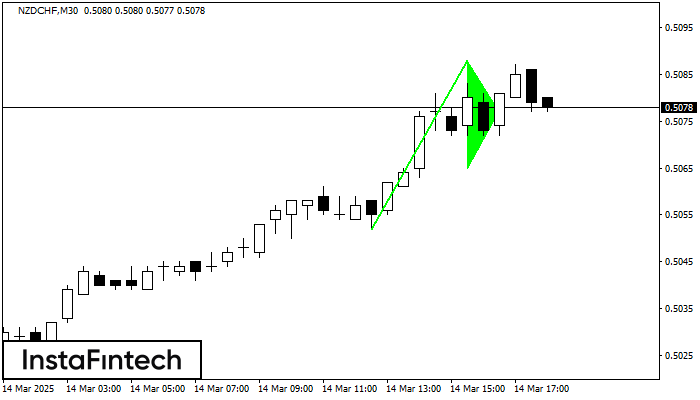
The Bullish pennant graphic pattern has formed on the NZDCHF M30 instrument. This pattern type falls under the category of continuation patterns. In this case, if the quote can breaks
Open chart in a new window
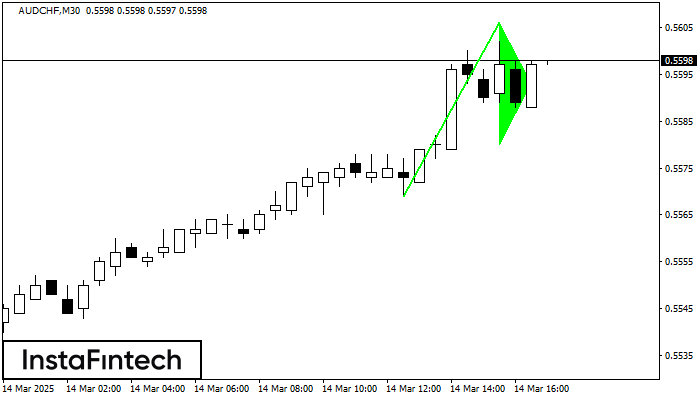
The Bullish pennant pattern is formed on the AUDCHF M30 chart. It is a type of the continuation pattern. Supposedly, in case the price is fixed above the pennant’s high
Open chart in a new window
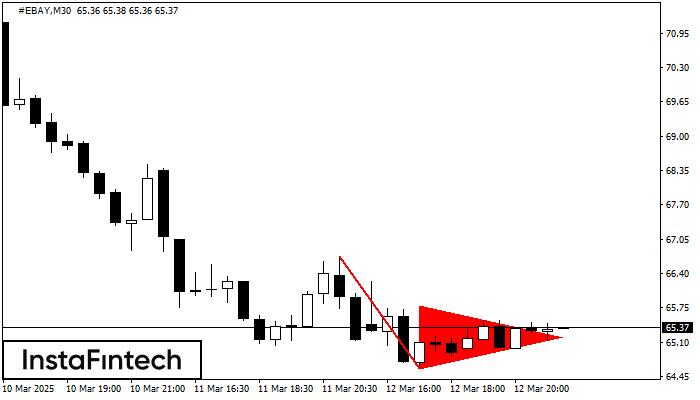
The Bearish pennant pattern has formed on the #EBAY M30 chart. This pattern type is characterized by a slight slowdown after which the price will move in the direction
Open chart in a new window


Your IP address shows that you are currently located in the USA. If you are a resident of the United States, you are prohibited from using the services of InstaFintech Group including online trading, online transfers, deposit/withdrawal of funds, etc.
If you think you are seeing this message by mistake and your location is not the US, kindly proceed to the website. Otherwise, you must leave the website in order to comply with government restrictions.
Why does your IP address show your location as the USA?
Please confirm whether you are a US resident or not by clicking the relevant button below. If you choose the wrong option, being a US resident, you will not be able to open an account with InstaTrade anyway.
We are sorry for any inconvenience caused by this message.