

Patrones actuales

Los patrones son modelos gráficos que se forman en el gráfico mediante el precio. Según uno de los postulados del análisis técnico, la historia (movimiento del precio) se repite. Esto quiere decir que los movimientos del precio a menudo son similares en las mismas situaciones que hacen posible pronosticar el futuro desarrollo de la situación con una alta probabilidad.
Los patrones relevantes de InstaTrade son un servicio fácil de utilizar que permiten que conozca los últimos cambios en el mercado y reaccione a las pistas del mercado a tiempo. En nuestro servicio, siempre encontrará los últimos y más importantes patrones en cualquier par y en cualquier marco de tiempo.
Triple Top
was formed on 25.03 at 03:55:23 (UTC+0)
signal strength 1 of 5
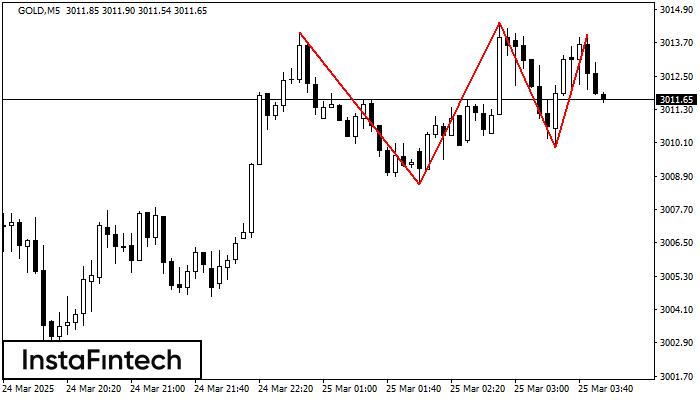
On the chart of the GOLD M5 trading instrument, the Triple Top pattern that signals a trend change has formed. It is possible that after formation of the third peak, the price will try to break through the resistance level 3008.62, where we advise to open a trading position for sale. Take profit is the projection of the pattern’s width, which is 544 points.
The M5 and M15 time frames may have more false entry points.
- All
- All
- Bearish Rectangle
- Bearish Symmetrical Triangle
- Bearish Symmetrical Triangle
- Bullish Rectangle
- Double Top
- Double Top
- Triple Bottom
- Triple Bottom
- Triple Top
- Triple Top
- All
- All
- Buy
- Sale
- All
- 1
- 2
- 3
- 4
- 5
Cabeza y Hombros Inverso
was formed on 27.03 at 09:00:09 (UTC+0)
signal strength 3 of 5
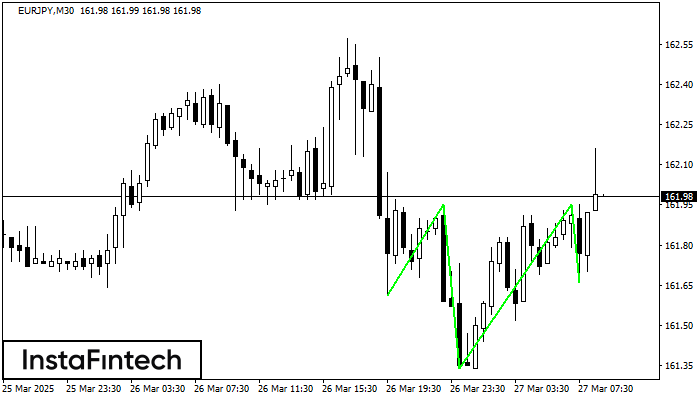
Según M30, EURJPY está formando el patrón técnico: el Cabeza y Hombros Inverso. En caso de que la línea de cuello 161.95/161.95 se rompa, es posible que el instrumento
Open chart in a new window
Rectángulo Alcista
was formed on 27.03 at 08:06:38 (UTC+0)
signal strength 1 of 5
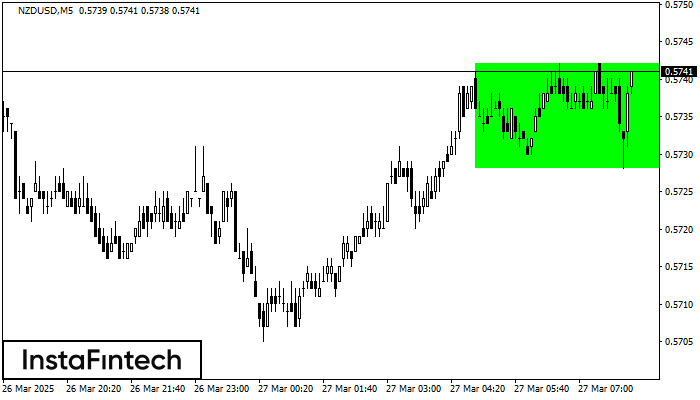
Según el gráfico de M5, NZDUSD formó el Rectángulo Alcista que es un patrón de la continuación de una tendencia. El patrón está contenido dentro de los siguientes límites
Los marcos de tiempo M5 y M15 pueden tener más puntos de entrada falsos.
Open chart in a new window
Doble Techo
was formed on 27.03 at 07:45:08 (UTC+0)
signal strength 2 of 5
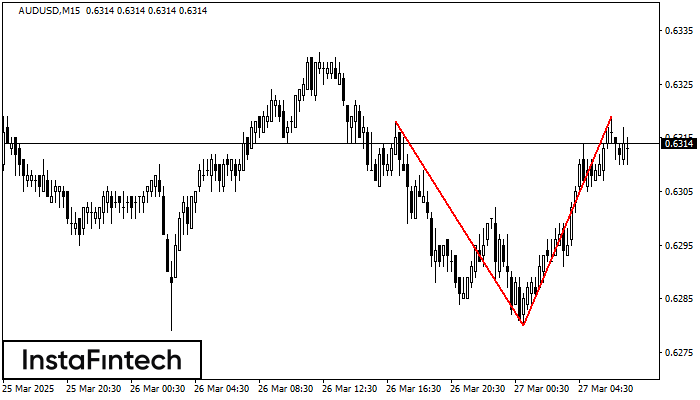
El patrón Doble Techo ha sido formado en AUDUSD M15. Esto señala que la tendencia ha sido cambiada de alcista a bajista. Probablemente, si la base del patrón 0.6280
Los marcos de tiempo M5 y M15 pueden tener más puntos de entrada falsos.
Open chart in a new window


