

Patrones actuales

Los patrones son modelos gráficos que se forman en el gráfico mediante el precio. Según uno de los postulados del análisis técnico, la historia (movimiento del precio) se repite. Esto quiere decir que los movimientos del precio a menudo son similares en las mismas situaciones que hacen posible pronosticar el futuro desarrollo de la situación con una alta probabilidad.
Los patrones relevantes de InstaTrade son un servicio fácil de utilizar que permiten que conozca los últimos cambios en el mercado y reaccione a las pistas del mercado a tiempo. En nuestro servicio, siempre encontrará los últimos y más importantes patrones en cualquier par y en cualquier marco de tiempo.
Bearish pennant
was formed on 18.03 at 18:47:10 (UTC+0)
signal strength 2 of 5
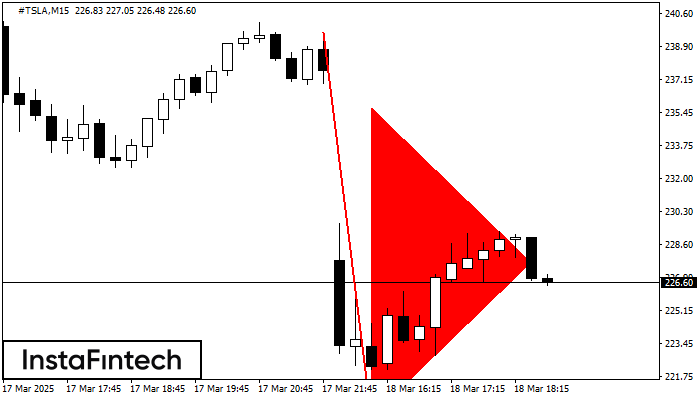
The Bearish pennant pattern has formed on the #TSLA M15 chart. It signals potential continuation of the existing trend. Specifications: the pattern’s bottom has the coordinate of 219.61; the projection of the flagpole height is equal to 2002 pips. In case the price breaks out the pattern’s bottom of 219.61, the downtrend is expected to continue for further level 219.38.
The M5 and M15 time frames may have more false entry points.
Vea asimismo
- All
- All
- Bearish Rectangle
- Bearish Symmetrical Triangle
- Bearish Symmetrical Triangle
- Bullish Rectangle
- Double Top
- Double Top
- Triple Bottom
- Triple Bottom
- Triple Top
- Triple Top
- All
- All
- Buy
- Sale
- All
- 1
- 2
- 3
- 4
- 5
Triángulo Simétrico Alcista
was formed on 19.03 at 07:49:14 (UTC+0)
signal strength 3 of 5
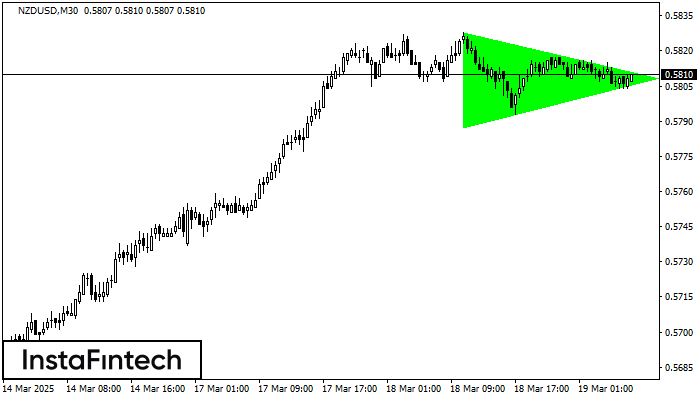
Según el gráfico de M30, NZDUSD formó el patrón Triángulo Simétrico Alcista. Descripción: Este es el patrón de la continuación de una tendencia. 0.5828 y 0.5788 son las coordenadas
Open chart in a new window
Triángulo Simétrico Bajista
was formed on 19.03 at 07:40:54 (UTC+0)
signal strength 1 of 5
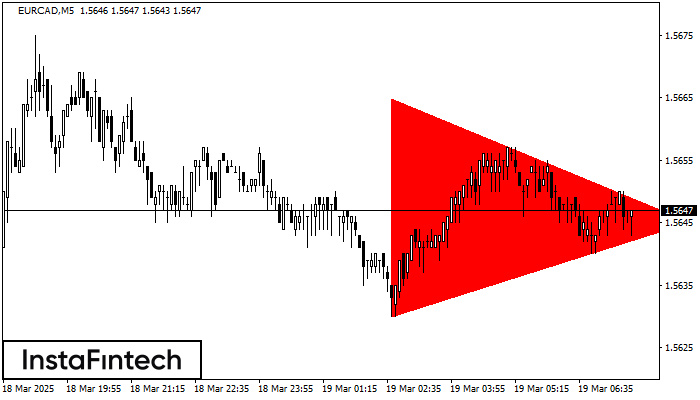
Según el gráfico de M5, el EURCAD formó el patrón Triángulo Simétrico Bajista. Recomendaciones de negociación: es posible que una ruptura del límite inferior 1.5630 fomente una continuación
Los marcos de tiempo M5 y M15 pueden tener más puntos de entrada falsos.
Open chart in a new window
Triple Piso
was formed on 19.03 at 07:32:02 (UTC+0)
signal strength 3 of 5
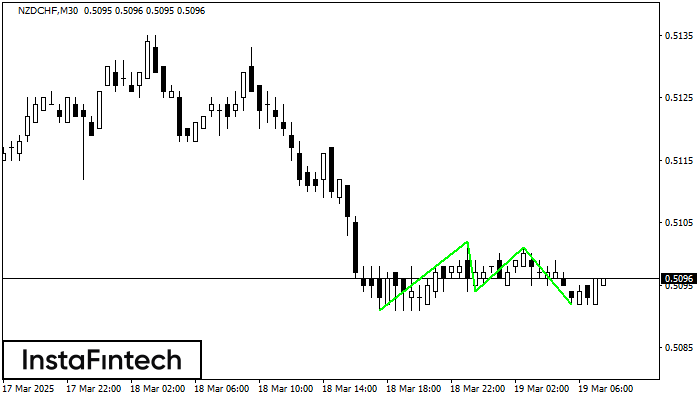
El patrón Triple Piso ha sido formado en NZDCHF M30. Este tiene las siguientes características: nivel de resistencia 0.5102/0.5101; nivel de soporte 0.5091/0.5092; el ancho es 11 puntos. En caso
Open chart in a new window


