Актуальные паттерны

Паттерны – это графические модели, которые "рисует" цена на графике. Один из постулатов технического анализа говорит нам о том, что история (движение цены) всегда повторяется. Это значит, что в похожих ситуациях движение цены, зачастую, будет похожим, что позволяет с высокой долей вероятности спрогнозировать дальнейшее развитие ситуации.
Актуальные паттерны от ИнстаФорекс – это удобный сервис, который позволит вам всегда быть в курсе последних изменений на рынке и вовремя реагировать на появившиеся подсказки от рынка. В нашем сервисе вы всегда найдете самые свежие и актуальные паттерны на любой паре и на любом таймфрейме.
Тройная вершина
сформирован 27.03 в 04:30:09 (UTC+0)
сила сигнала 2 из 5
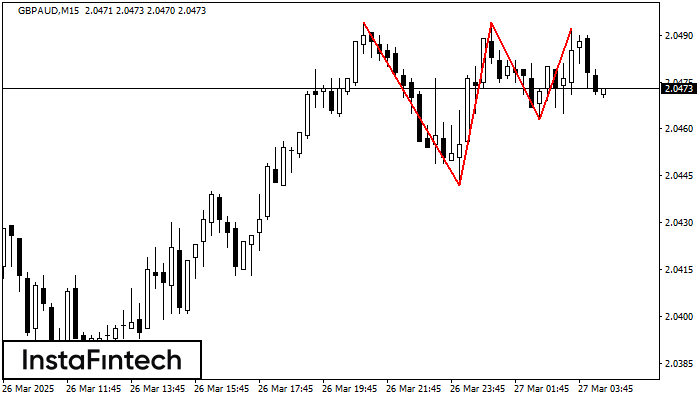
На графике GBPAUD M15 образовалась фигура «Тройная вершина». Данная фигура относится к типу разворотных и имеет характеристику: Верхняя граница 2.0494/2.0492; Нижняя граница 2.0442/2.0463; Ширина фигуры 31 пунктов. Прогноз: В случае пробоя нижней границы 2.0442 вероятно дальнейшее нисходящее движение к уровню 2.0471.
Таймфреймы М5 и М15 могут иметь больше ложных точек входа.
- Все
- Все
- Bearish Rectangle
- Bearish Symmetrical Triangle
- Bearish Symmetrical Triangle
- Bullish Rectangle
- Double Top
- Double Top
- Triple Bottom
- Triple Bottom
- Triple Top
- Triple Top
- Все
- Все
- Покупка
- Продажа
- Все
- 1
- 2
- 3
- 4
- 5
Triple Bottom
was formed on 02.04 at 12:55:26 (UTC+0)
signal strength 1 of 5
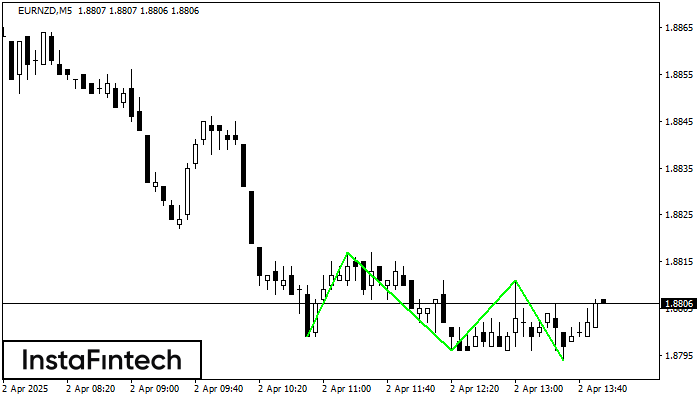
The Triple Bottom pattern has been formed on EURNZD M5. It has the following characteristics: resistance level 1.8817/1.8811; support level 1.8799/1.8794; the width is 18 points. In the event
The M5 and M15 time frames may have more false entry points.
Open chart in a new window
Double Top
was formed on 02.04 at 12:30:07 (UTC+0)
signal strength 3 of 5
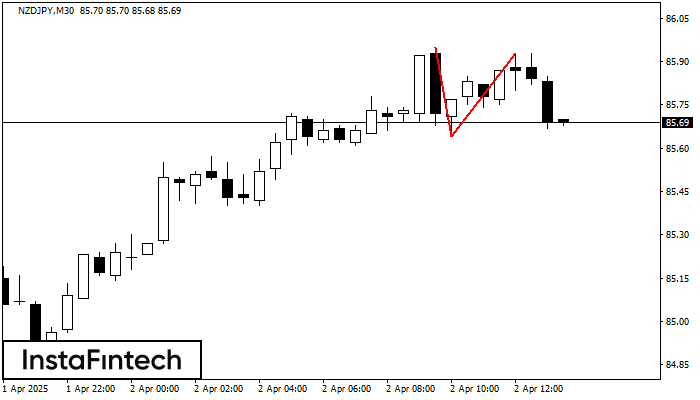
The Double Top reversal pattern has been formed on NZDJPY M30. Characteristics: the upper boundary 85.95; the lower boundary 85.64; the width of the pattern is 29 points. Sell trades
Open chart in a new window
Double Top
was formed on 02.04 at 12:15:40 (UTC+0)
signal strength 2 of 5
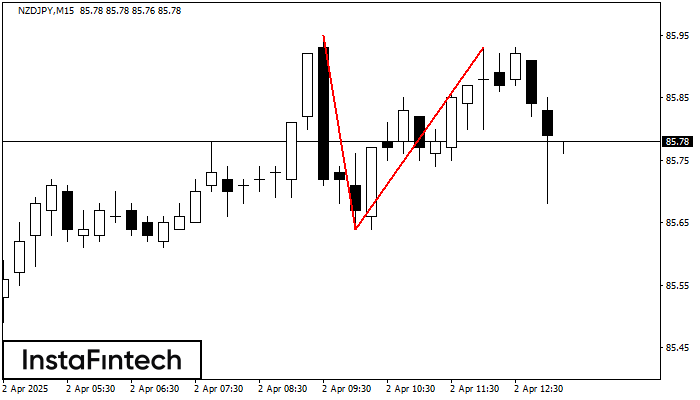
The Double Top reversal pattern has been formed on NZDJPY M15. Characteristics: the upper boundary 85.95; the lower boundary 85.64; the width of the pattern is 29 points. Sell trades
The M5 and M15 time frames may have more false entry points.
Open chart in a new window