Актуальные паттерны

Паттерны – это графические модели, которые "рисует" цена на графике. Один из постулатов технического анализа говорит нам о том, что история (движение цены) всегда повторяется. Это значит, что в похожих ситуациях движение цены, зачастую, будет похожим, что позволяет с высокой долей вероятности спрогнозировать дальнейшее развитие ситуации.
Актуальные паттерны от ИнстаФорекс – это удобный сервис, который позволит вам всегда быть в курсе последних изменений на рынке и вовремя реагировать на появившиеся подсказки от рынка. В нашем сервисе вы всегда найдете самые свежие и актуальные паттерны на любой паре и на любом таймфрейме.
Двойное дно
сформирован 25.03 в 00:00:26 (UTC+0)
сила сигнала 5 из 5
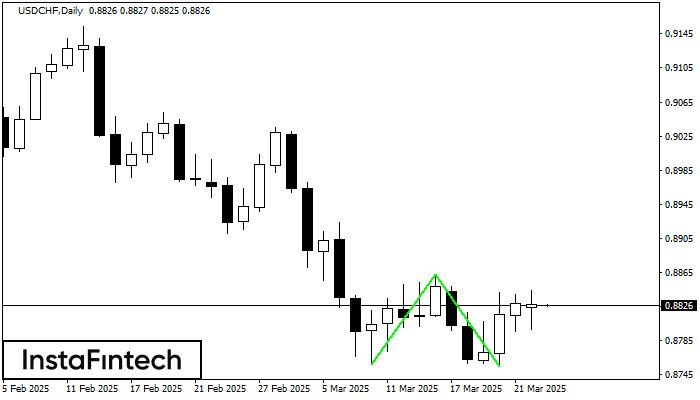
Сформирована фигура «Двойное дно» на графике USDCHF D1. Характеристика: Уровень поддержки 0.8757; Уровень сопротивления 0.8863; Ширина фигуры 106 пунктов. В случае пробоя уровня сопротивления можно будет прогнозировать изменение тенденции, где первая точка фиксации прибыли находится на расстоянии 108 пунктов.
Смотрите также
- Все
- Все
- Bearish Rectangle
- Bearish Symmetrical Triangle
- Bearish Symmetrical Triangle
- Bullish Rectangle
- Double Top
- Double Top
- Triple Bottom
- Triple Bottom
- Triple Top
- Triple Top
- Все
- Все
- Покупка
- Продажа
- Все
- 1
- 2
- 3
- 4
- 5
Double Top
was formed on 17.04 at 18:15:13 (UTC+0)
signal strength 1 of 5
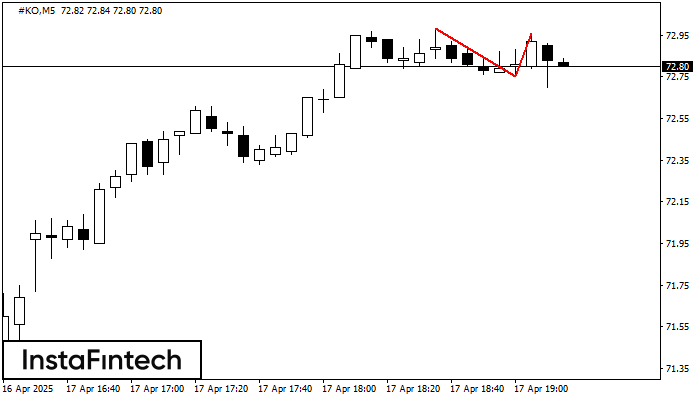
On the chart of #KO M5 the Double Top reversal pattern has been formed. Characteristics: the upper boundary 72.96; the lower boundary 72.75; the width of the pattern 21 points
The M5 and M15 time frames may have more false entry points.
Open chart in a new window
Double Bottom
was formed on 17.04 at 18:00:01 (UTC+0)
signal strength 1 of 5
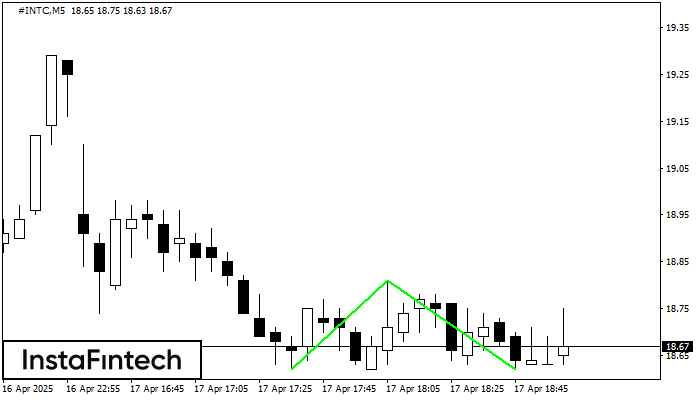
The Double Bottom pattern has been formed on #INTC M5; the upper boundary is 18.81; the lower boundary is 18.62. The width of the pattern is 19 points. In case
The M5 and M15 time frames may have more false entry points.
Open chart in a new window
Triple Top
was formed on 17.04 at 17:45:29 (UTC+0)
signal strength 1 of 5

On the chart of the NZDCAD M5 trading instrument, the Triple Top pattern that signals a trend change has formed. It is possible that after formation of the third peak
The M5 and M15 time frames may have more false entry points.
Open chart in a new window