Актуальные паттерны

Паттерны – это графические модели, которые "рисует" цена на графике. Один из постулатов технического анализа говорит нам о том, что история (движение цены) всегда повторяется. Это значит, что в похожих ситуациях движение цены, зачастую, будет похожим, что позволяет с высокой долей вероятности спрогнозировать дальнейшее развитие ситуации.
Актуальные паттерны от ИнстаФорекс – это удобный сервис, который позволит вам всегда быть в курсе последних изменений на рынке и вовремя реагировать на появившиеся подсказки от рынка. В нашем сервисе вы всегда найдете самые свежие и актуальные паттерны на любой паре и на любом таймфрейме.
Прямоугольник
сформирован 21.03 в 21:13:56 (UTC+0)
сила сигнала 1 из 5
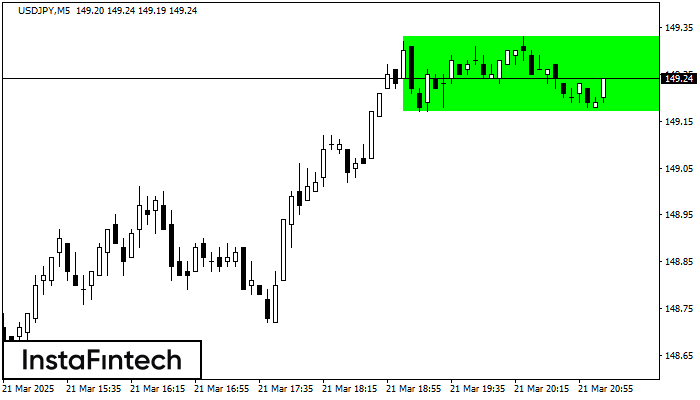
Сформирована фигура «Прямоугольник» на графике USDJPY M5. Тип фигуры: Продолжение тренда; Границы: Верхняя 149.33, Нижняя 149.17; Сигнал: позицию на покупку следует открывать выше верхней границы прямоугольника 149.33.
Таймфреймы М5 и М15 могут иметь больше ложных точек входа.
Смотрите также
- Все
- Все
- Bearish Rectangle
- Bearish Symmetrical Triangle
- Bearish Symmetrical Triangle
- Bullish Rectangle
- Double Top
- Double Top
- Triple Bottom
- Triple Bottom
- Triple Top
- Triple Top
- Все
- Все
- Покупка
- Продажа
- Все
- 1
- 2
- 3
- 4
- 5
Double Bottom
was formed on 25.03 at 04:45:36 (UTC+0)
signal strength 1 of 5
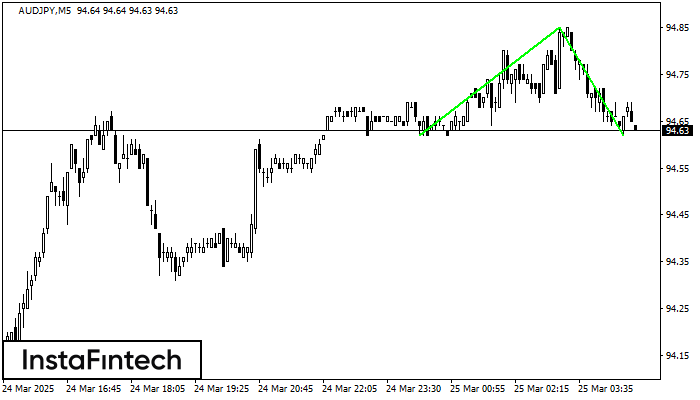
The Double Bottom pattern has been formed on AUDJPY M5; the upper boundary is 94.85; the lower boundary is 94.62. The width of the pattern is 23 points. In case
The M5 and M15 time frames may have more false entry points.
Open chart in a new window
Head and Shoulders
was formed on 25.03 at 04:15:36 (UTC+0)
signal strength 1 of 5

According to the chart of M5, USDJPY formed the Head and Shoulders pattern. The Head’s top is set at 150.87 while the median line of the Neck is found
The M5 and M15 time frames may have more false entry points.
Open chart in a new window
Double Top
was formed on 25.03 at 04:00:34 (UTC+0)
signal strength 2 of 5
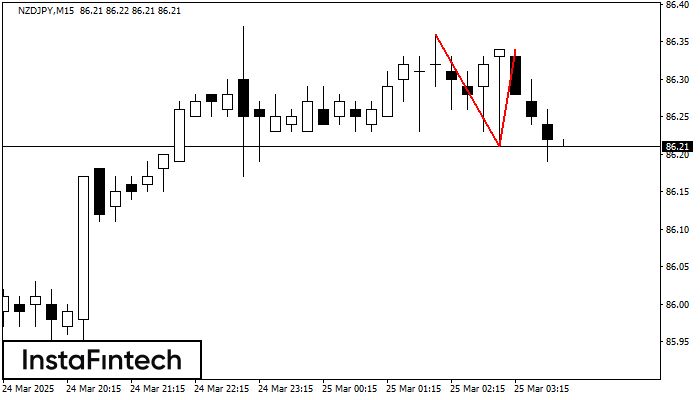
On the chart of NZDJPY M15 the Double Top reversal pattern has been formed. Characteristics: the upper boundary 86.34; the lower boundary 86.21; the width of the pattern 13 points
The M5 and M15 time frames may have more false entry points.
Open chart in a new window