Актуальные паттерны

Паттерны – это графические модели, которые "рисует" цена на графике. Один из постулатов технического анализа говорит нам о том, что история (движение цены) всегда повторяется. Это значит, что в похожих ситуациях движение цены, зачастую, будет похожим, что позволяет с высокой долей вероятности спрогнозировать дальнейшее развитие ситуации.
Актуальные паттерны от ИнстаФорекс – это удобный сервис, который позволит вам всегда быть в курсе последних изменений на рынке и вовремя реагировать на появившиеся подсказки от рынка. В нашем сервисе вы всегда найдете самые свежие и актуальные паттерны на любой паре и на любом таймфрейме.
Голова и плечи
сформирован 20.03 в 20:30:27 (UTC+0)
сила сигнала 1 из 5
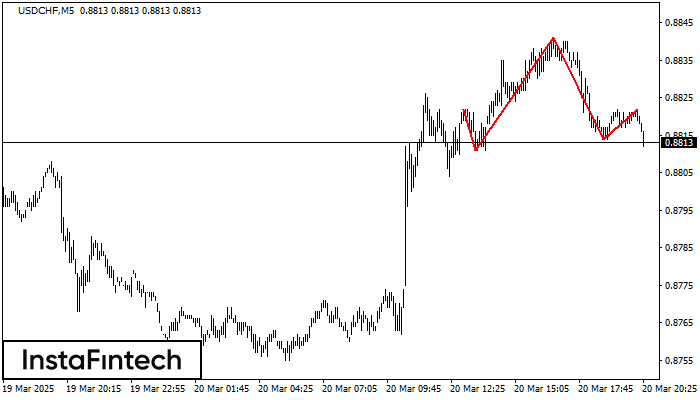
На графике USDCHF M5 сформировалась фигура «Голова и плечи» с характеристикой: Вершина головы 0.8841; Уровень шеи, восходящий угол - 0.8811/0.8814. Формирование данной фигуры может привести к изменению текущей тенденции с восходящей на нисходящую. Вероятно предполагать, что курс USDCHF, в случае срабатывания фигуры, пойдет в направлении 0.8799 (10 - 20 пунктов).
Таймфреймы М5 и М15 могут иметь больше ложных точек входа.
Смотрите также
- Все
- Все
- Bearish Rectangle
- Bearish Symmetrical Triangle
- Bearish Symmetrical Triangle
- Bullish Rectangle
- Double Top
- Double Top
- Triple Bottom
- Triple Bottom
- Triple Top
- Triple Top
- Все
- Все
- Покупка
- Продажа
- Все
- 1
- 2
- 3
- 4
- 5
Double Bottom
was formed on 22.03 at 17:34:47 (UTC+0)
signal strength 1 of 5

The Double Bottom pattern has been formed on #Bitcoin M5. Characteristics: the support level 83931.70; the resistance level 84051.13; the width of the pattern 11943 points. If the resistance level
The M5 and M15 time frames may have more false entry points.
Open chart in a new window
Bullish Symmetrical Triangle
was formed on 21.03 at 22:40:31 (UTC+0)
signal strength 1 of 5

According to the chart of M5, AUDUSD formed the Bullish Symmetrical Triangle pattern. Description: This is the pattern of a trend continuation. 0.6279 and 0.6267 are the coordinates
The M5 and M15 time frames may have more false entry points.
Open chart in a new window
Bullish Symmetrical Triangle
was formed on 21.03 at 22:36:29 (UTC+0)
signal strength 1 of 5

According to the chart of M5, USDCHF formed the Bullish Symmetrical Triangle pattern. The lower border of the pattern touches the coordinates 0.8825/0.8830 whereas the upper border goes across 0.8835/0.8830
The M5 and M15 time frames may have more false entry points.
Open chart in a new window