Актуальные паттерны

Паттерны – это графические модели, которые "рисует" цена на графике. Один из постулатов технического анализа говорит нам о том, что история (движение цены) всегда повторяется. Это значит, что в похожих ситуациях движение цены, зачастую, будет похожим, что позволяет с высокой долей вероятности спрогнозировать дальнейшее развитие ситуации.
Актуальные паттерны от ИнстаФорекс – это удобный сервис, который позволит вам всегда быть в курсе последних изменений на рынке и вовремя реагировать на появившиеся подсказки от рынка. В нашем сервисе вы всегда найдете самые свежие и актуальные паттерны на любой паре и на любом таймфрейме.
Прямоугольник
сформирован 17.03 в 19:24:15 (UTC+0)
сила сигнала 3 из 5
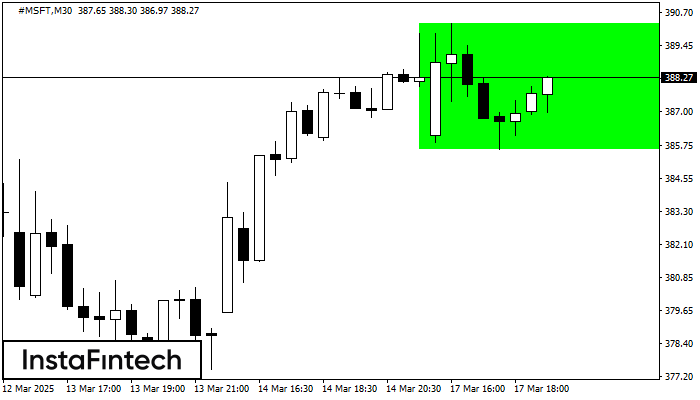
По #MSFT на M30 сформировалась фигура «Прямоугольник». Фигура данного типа относится к тому типу продолжения тренда, который содержит в себе два уровня: Сопротивление 390.29; Поддержка 385.61. В случае пробоя уровня сопротивления 390.29 возможно дальнейшее восходящее движение.
- Все
- Все
- Bearish Rectangle
- Bearish Symmetrical Triangle
- Bearish Symmetrical Triangle
- Bullish Rectangle
- Double Top
- Double Top
- Triple Bottom
- Triple Bottom
- Triple Top
- Triple Top
- Все
- Все
- Покупка
- Продажа
- Все
- 1
- 2
- 3
- 4
- 5
Bearish Symmetrical Triangle
was formed on 18.03 at 08:42:54 (UTC+0)
signal strength 1 of 5
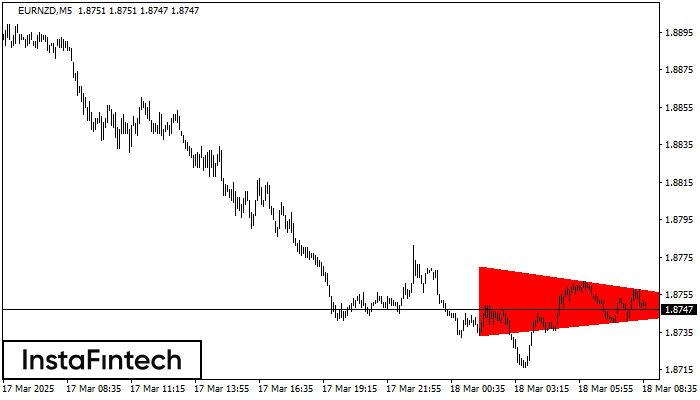
According to the chart of M5, EURNZD formed the Bearish Symmetrical Triangle pattern. Description: The lower border is 1.8733/1.8748 and upper border is 1.8770/1.8748. The pattern width is measured
The M5 and M15 time frames may have more false entry points.
Open chart in a new window
Head and Shoulders
was formed on 18.03 at 08:30:10 (UTC+0)
signal strength 3 of 5
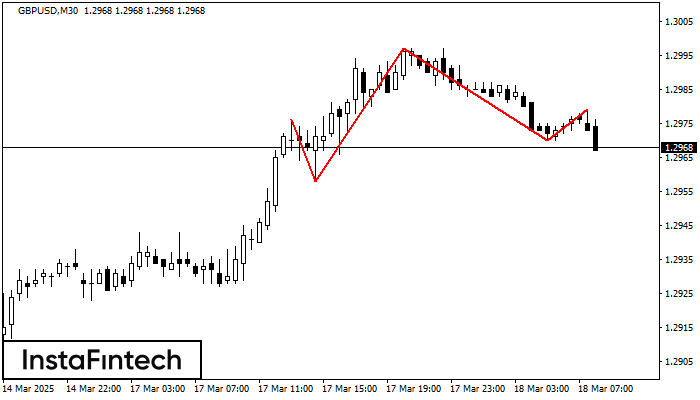
The technical pattern called Head and Shoulders has appeared on the chart of GBPUSD M30. There are weighty reasons to suggest that the price will surpass the Neckline 1.2958/1.2970 after
Open chart in a new window
Triple Top
was formed on 18.03 at 08:01:01 (UTC+0)
signal strength 1 of 5
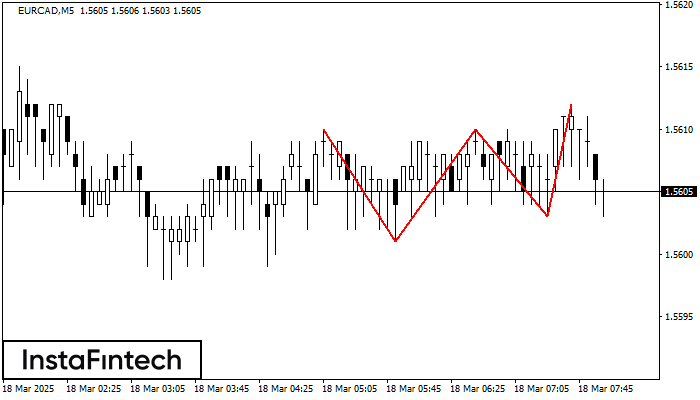
The Triple Top pattern has formed on the chart of the EURCAD M5. Features of the pattern: borders have an ascending angle; the lower line of the pattern
The M5 and M15 time frames may have more false entry points.
Open chart in a new window