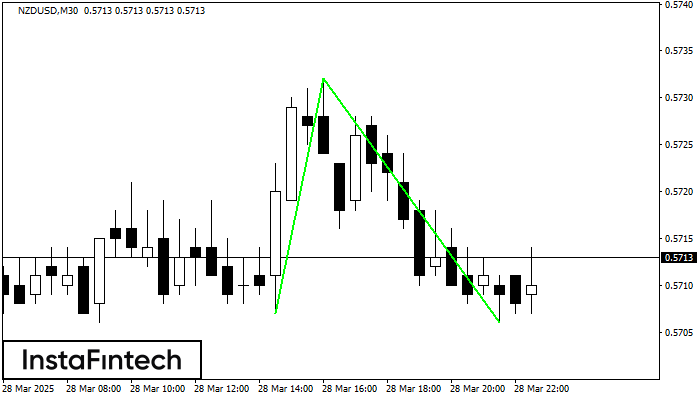
Double Bottom
was formed on 30.03 at 23:00:31 (UTC+0)
signal strength 3 of 5

The Double Bottom pattern has been formed on NZDUSD M30. This formation signals a reversal of the trend from downwards to upwards. The signal is that a buy trade should be opened after the upper boundary of the pattern 0.5732 is broken. The further movements will rely on the width of the current pattern 25 points.
Veja também
- All
- All
- Bearish Rectangle
- Bearish Symmetrical Triangle
- Bearish Symmetrical Triangle
- Bullish Rectangle
- Double Top
- Double Top
- Triple Bottom
- Triple Bottom
- Triple Top
- Triple Top
- All
- All
- Buy
- Sale
- All
- 1
- 2
- 3
- 4
- 5
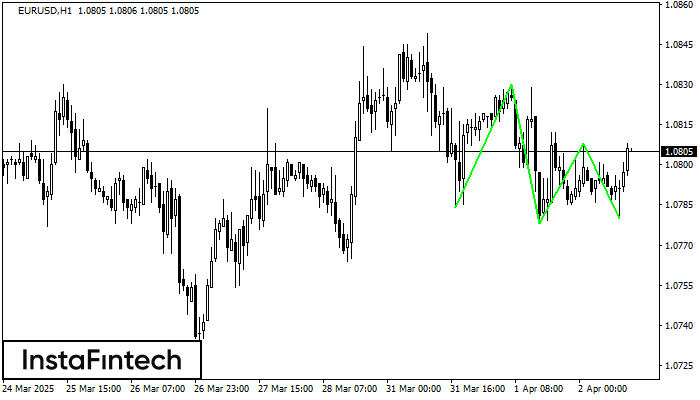
Fundo triplo
was formed on 02.04 at 12:00:59 (UTC+0)
signal strength 4 of 5
O padrão Fundo triplo foi formado em EURUSD H1. Possui as seguintes características: nível de resistência 1.0830/1.0808; nível de suporte 1.0784/1.0780; a largura é de 46 pontos. Se houver
Open chart in a new window
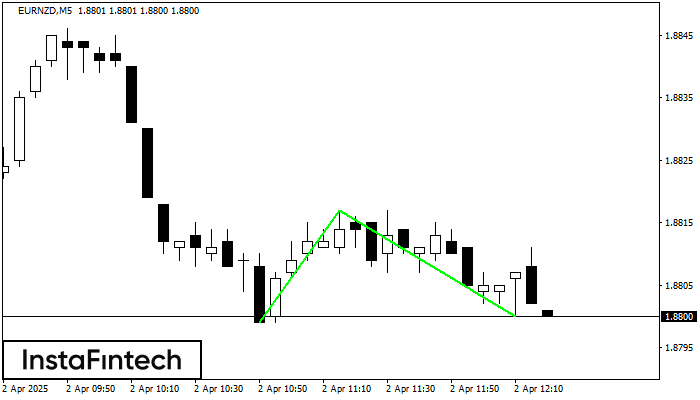
Fundo duplo
was formed on 02.04 at 11:20:53 (UTC+0)
signal strength 1 of 5
O padrão Fundo duplo foi formado em EURNZD M5. Características: o nível de suporte 1.8799; o nível de resistência 1.8817; a largura do padrão 18 pontos. Se o nível
Os intervalos M5 e M15 podem ter mais pontos de entrada falsos.
Open chart in a new window
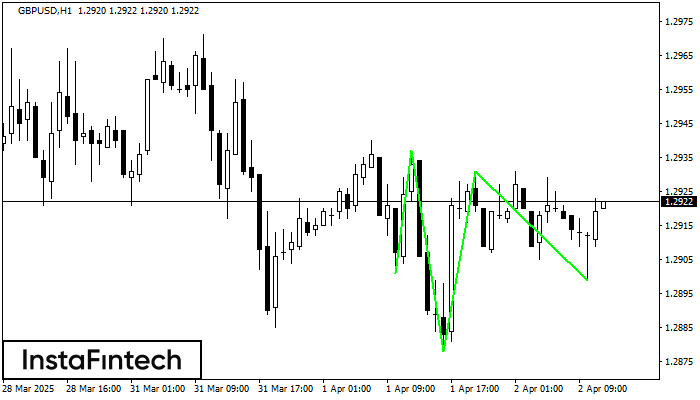
Cabeça & Ombro Invertidos
was formed on 02.04 at 11:00:29 (UTC+0)
signal strength 4 of 5
De acordo com H1, GBPUSD está moldando o padrão técnico – os Cabeça & Ombro Invertidos. Caso a linha de pescoço 1.2937/1.2931 seja quebrada, o instrumento provavelmente se moverá para
Open chart in a new window


