

Padrões atuais

Padrões são modelos gráficos que são formados no gráfico pelo preço. Segundo um dos postulados da análise técnica, a história (movimento de preços) se repete. Isso significa que os movimentos de preços geralmente são semelhantes nas mesmas situações, o que possibilita prever o desenvolvimento futuro da situação com alta probabilidade.
Os padrões relevantes da InstaTrade são um serviço fácil de usar, que permite que você esteja ciente das últimas mudanças no mercado e reaja a indícios do mercado a tempo. Em nosso serviço, você sempre encontrará os padrões mais recentes e relevantes em qualquer par e em qualquer período gráfico.
Triple Top
was formed on 27.03 at 04:30:09 (UTC+0)
signal strength 2 of 5
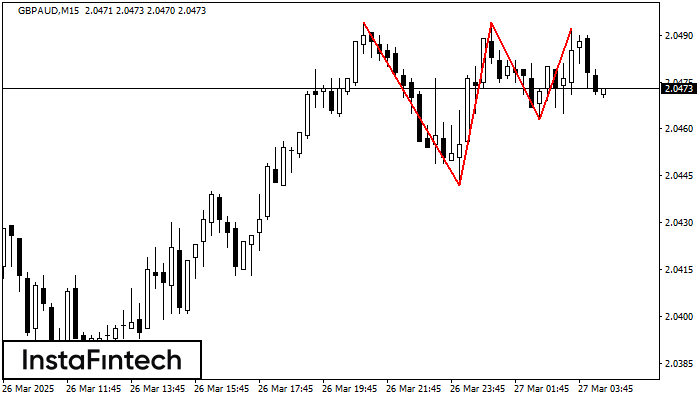
On the chart of the GBPAUD M15 trading instrument, the Triple Top pattern that signals a trend change has formed. It is possible that after formation of the third peak, the price will try to break through the resistance level 2.0442, where we advise to open a trading position for sale. Take profit is the projection of the pattern’s width, which is 52 points.
The M5 and M15 time frames may have more false entry points.
- All
- All
- Bearish Rectangle
- Bearish Symmetrical Triangle
- Bearish Symmetrical Triangle
- Bullish Rectangle
- Double Top
- Double Top
- Triple Bottom
- Triple Bottom
- Triple Top
- Triple Top
- All
- All
- Buy
- Sale
- All
- 1
- 2
- 3
- 4
- 5
Double Top
was formed on 14.04 at 12:45:36 (UTC+0)
signal strength 2 of 5
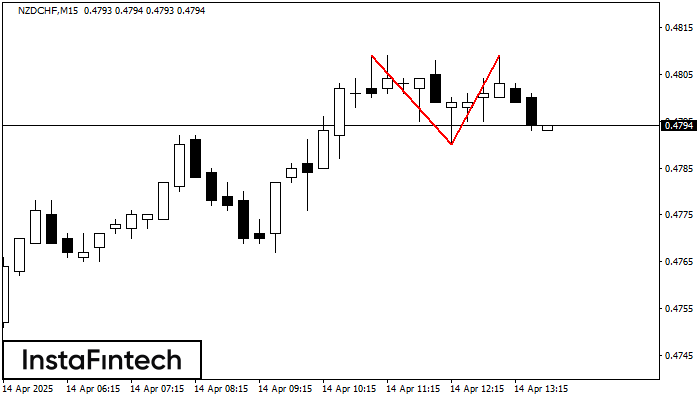
The Double Top pattern has been formed on NZDCHF M15. It signals that the trend has been changed from upwards to downwards. Probably, if the base of the pattern 0.4790
The M5 and M15 time frames may have more false entry points.
Open chart in a new window
Bullish Rectangle
was formed on 14.04 at 12:32:13 (UTC+0)
signal strength 1 of 5
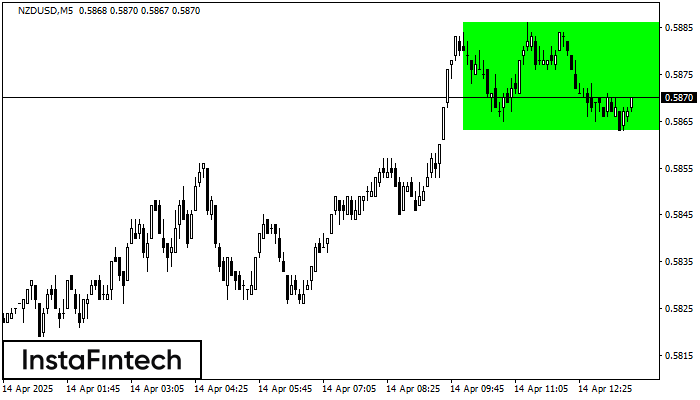
According to the chart of M5, NZDUSD formed the Bullish Rectangle. This type of a pattern indicates a trend continuation. It consists of two levels: resistance 0.5886 and support 0.5863
The M5 and M15 time frames may have more false entry points.
Open chart in a new window
Double Top
was formed on 14.04 at 12:20:34 (UTC+0)
signal strength 1 of 5
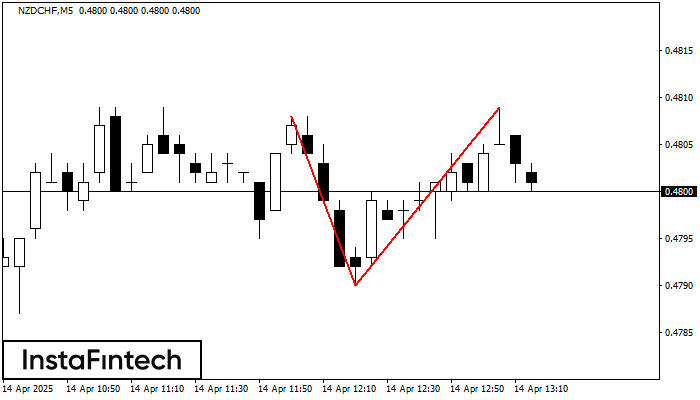
On the chart of NZDCHF M5 the Double Top reversal pattern has been formed. Characteristics: the upper boundary 0.4809; the lower boundary 0.4790; the width of the pattern 19 points
The M5 and M15 time frames may have more false entry points.
Open chart in a new window


