

Padrões atuais

Padrões são modelos gráficos que são formados no gráfico pelo preço. Segundo um dos postulados da análise técnica, a história (movimento de preços) se repete. Isso significa que os movimentos de preços geralmente são semelhantes nas mesmas situações, o que possibilita prever o desenvolvimento futuro da situação com alta probabilidade.
Os padrões relevantes da InstaTrade são um serviço fácil de usar, que permite que você esteja ciente das últimas mudanças no mercado e reaja a indícios do mercado a tempo. Em nosso serviço, você sempre encontrará os padrões mais recentes e relevantes em qualquer par e em qualquer período gráfico.
Bullish pennant
was formed on 21.03 at 19:30:27 (UTC+0)
signal strength 1 of 5
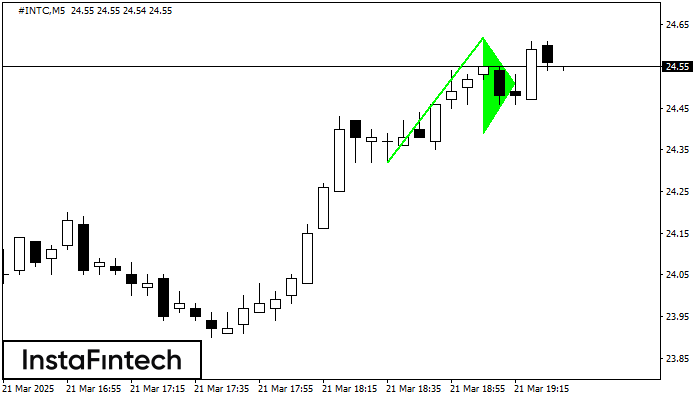
The Bullish pennant pattern is formed on the #INTC M5 chart. It is a type of the continuation pattern. Supposedly, in case the price is fixed above the pennant’s high of 24.62, a further uptrend is possible.
The M5 and M15 time frames may have more false entry points.
Veja também
- All
- All
- Bearish Rectangle
- Bearish Symmetrical Triangle
- Bearish Symmetrical Triangle
- Bullish Rectangle
- Double Top
- Double Top
- Triple Bottom
- Triple Bottom
- Triple Top
- Triple Top
- All
- All
- Buy
- Sale
- All
- 1
- 2
- 3
- 4
- 5
Retângulo de baixa
was formed on 24.03 at 22:46:30 (UTC+0)
signal strength 3 of 5
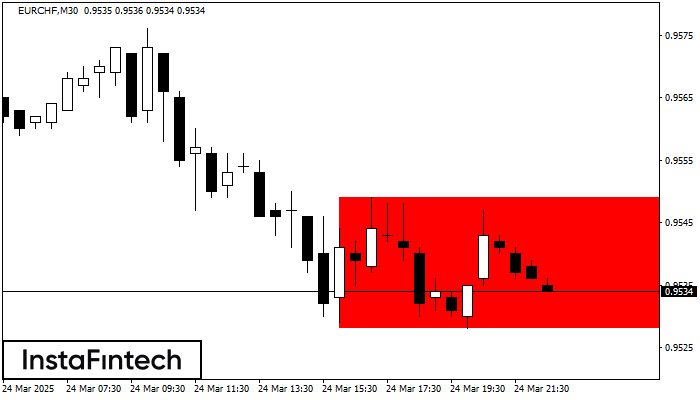
De acordo com o gráfico de M30, EURCHF formou Retângulo de baixa. Este tipo de padrão indica uma continuação da tendência. Ele consiste em dois níveis: resistência 0.9549 – 0.0000
Open chart in a new window
Retângulo de baixa
was formed on 24.03 at 21:46:19 (UTC+0)
signal strength 2 of 5
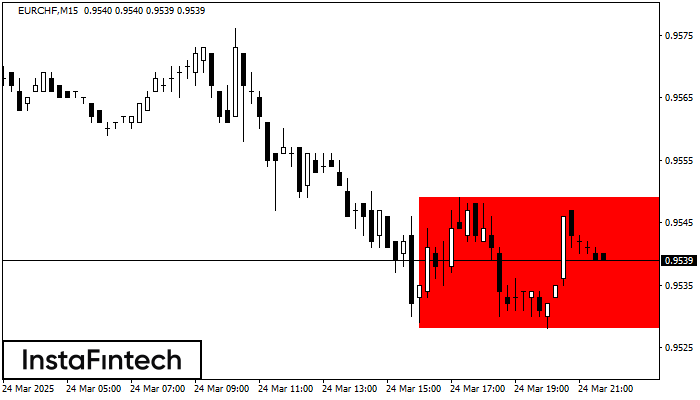
De acordo com o gráfico de M15, EURCHF formou Retângulo de baixa que é um padrão de uma continuação de tendência. O padrão está dentro dos seguintes limites: limite inferior
Os intervalos M5 e M15 podem ter mais pontos de entrada falsos.
Open chart in a new window
Pennant de alta
was formed on 24.03 at 21:30:30 (UTC+0)
signal strength 4 of 5
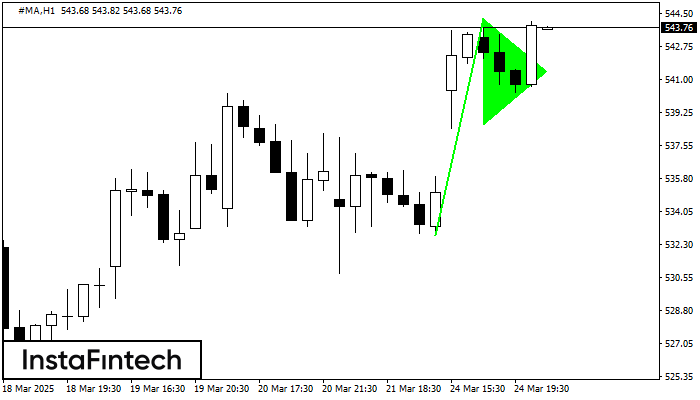
O padrão Pennant de alta é formado no gráfico #MA H1. Ele é um tipo do padrão de continuação. Supostamente, se o preço for fixado acima da alta de 544.23
Open chart in a new window


