

Padrões atuais

Padrões são modelos gráficos que são formados no gráfico pelo preço. Segundo um dos postulados da análise técnica, a história (movimento de preços) se repete. Isso significa que os movimentos de preços geralmente são semelhantes nas mesmas situações, o que possibilita prever o desenvolvimento futuro da situação com alta probabilidade.
Os padrões relevantes da InstaTrade são um serviço fácil de usar, que permite que você esteja ciente das últimas mudanças no mercado e reaja a indícios do mercado a tempo. Em nosso serviço, você sempre encontrará os padrões mais recentes e relevantes em qualquer par e em qualquer período gráfico.
Double Bottom
was formed on 21.03 at 03:15:41 (UTC+0)
signal strength 2 of 5
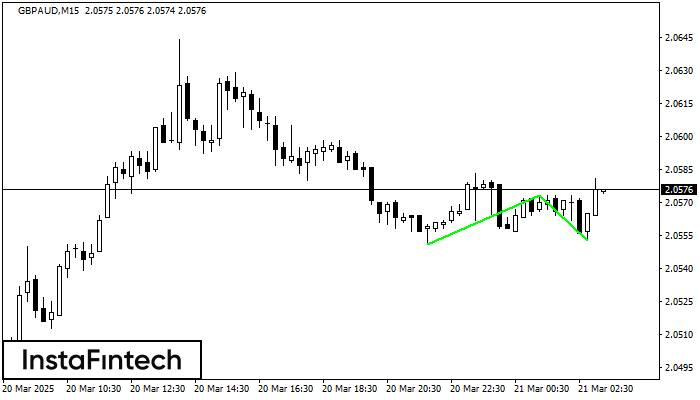
The Double Bottom pattern has been formed on GBPAUD M15; the upper boundary is 2.0573; the lower boundary is 2.0553. The width of the pattern is 22 points. In case of a break of the upper boundary 2.0573, a change in the trend can be predicted where the width of the pattern will coincide with the distance to a possible take profit level.
The M5 and M15 time frames may have more false entry points.
Veja também
- All
- All
- Bearish Rectangle
- Bearish Symmetrical Triangle
- Bearish Symmetrical Triangle
- Bullish Rectangle
- Double Top
- Double Top
- Triple Bottom
- Triple Bottom
- Triple Top
- Triple Top
- All
- All
- Buy
- Sale
- All
- 1
- 2
- 3
- 4
- 5
Fundo duplo
was formed on 31.03 at 09:45:35 (UTC+0)
signal strength 2 of 5
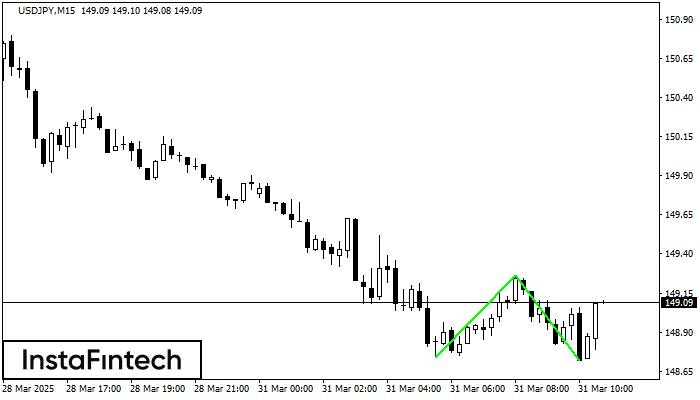
O padrão Fundo duplo foi formado em USDJPY M15. Características: o nível de suporte 148.74; o nível de resistência 149.26; a largura do padrão 52 pontos. Se o nível
Os intervalos M5 e M15 podem ter mais pontos de entrada falsos.
Open chart in a new window
Fundo duplo
was formed on 31.03 at 09:45:25 (UTC+0)
signal strength 2 of 5
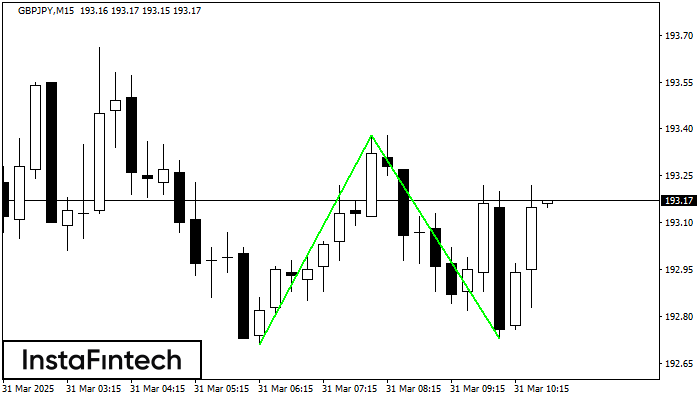
O padrão Fundo duplo foi formado em GBPJPY M15. Características: o nível de suporte 192.71; o nível de resistência 193.38; a largura do padrão 67 pontos. Se o nível
Os intervalos M5 e M15 podem ter mais pontos de entrada falsos.
Open chart in a new window
Topo duplo
was formed on 31.03 at 09:11:14 (UTC+0)
signal strength 1 of 5
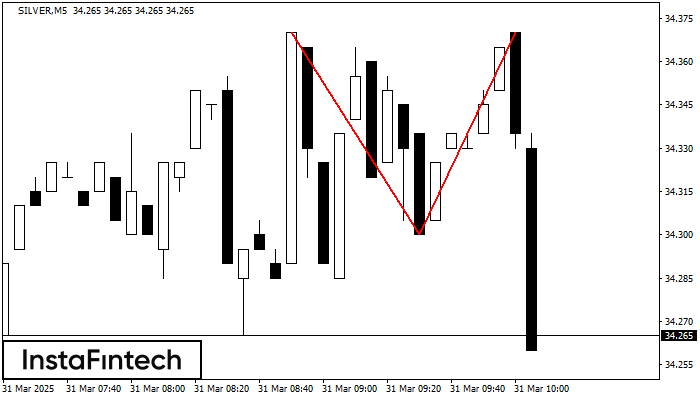
O padrão Topo duplo foi formado em SILVER M5. Isso sinaliza que a tendência foi alterada de cima para baixo. Provavelmente, se a base do padrão 34.30 for quebrada
Os intervalos M5 e M15 podem ter mais pontos de entrada falsos.
Open chart in a new window


