یہ بھی دیکھیں

 19.09.2024 02:55 AM
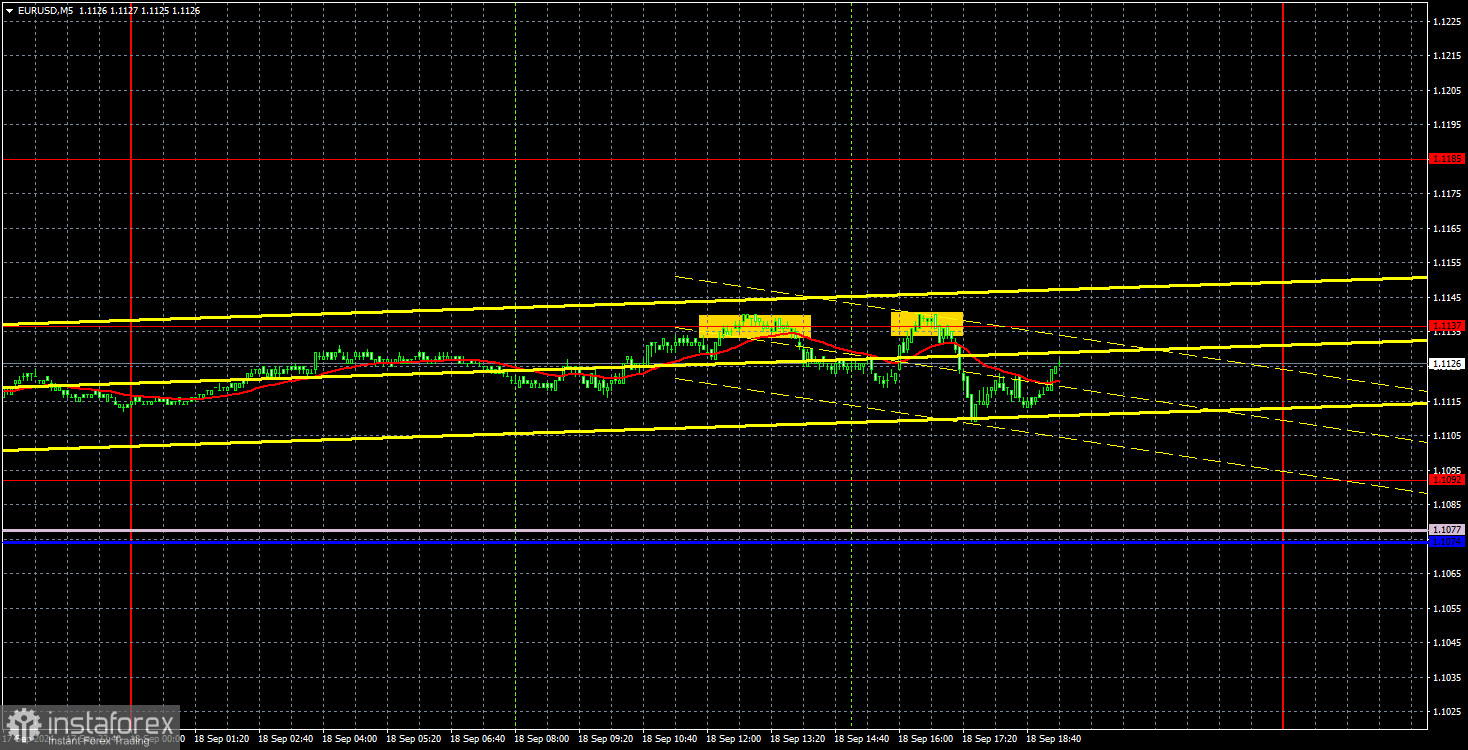
The EUR/USD pair was nearly immobilized on Wednesday. Volatility dropped to absolute lows. Let's note that we are not considering the movements after the FOMC meeting, as time needs to pass before the market settles. It's clear that volatility spikes multiple times immediately after the FOMC results are announced, but how can it be used? How do you trade movements when the pair can change direction 3-4 times in a few hours? This is why we believe that trading during such time frames makes no sense. It's just a path to losses.
Moreover, after the market calms down following the Federal Reserve meeting, the pair often returns to the same area where it was before the results were announced. What's important for us is to understand from the market's reaction how ready it is to continue buying within the two-year upward trend. Let's recall that the market has been pricing in the Fed's monetary easing since at least the beginning of 2024, which only started in September. It has been paying no attention to the European Central Bank's rate cuts, so it's crucial to understand how much longer this single factor— the Fed's rate cuts—will be priced in. That's what we need to focus on today and tomorrow.
Despite the overall low-volatility flat, the price generated two sell signals around the 1.1137 level. At most, it moved 20 pips downward. The signals were duplicates, so only one short position should have been opened. This trade had no loss, but the maximum profit would have been 20 pips. Given the total volatility of 30 pips, even this result is excellent.
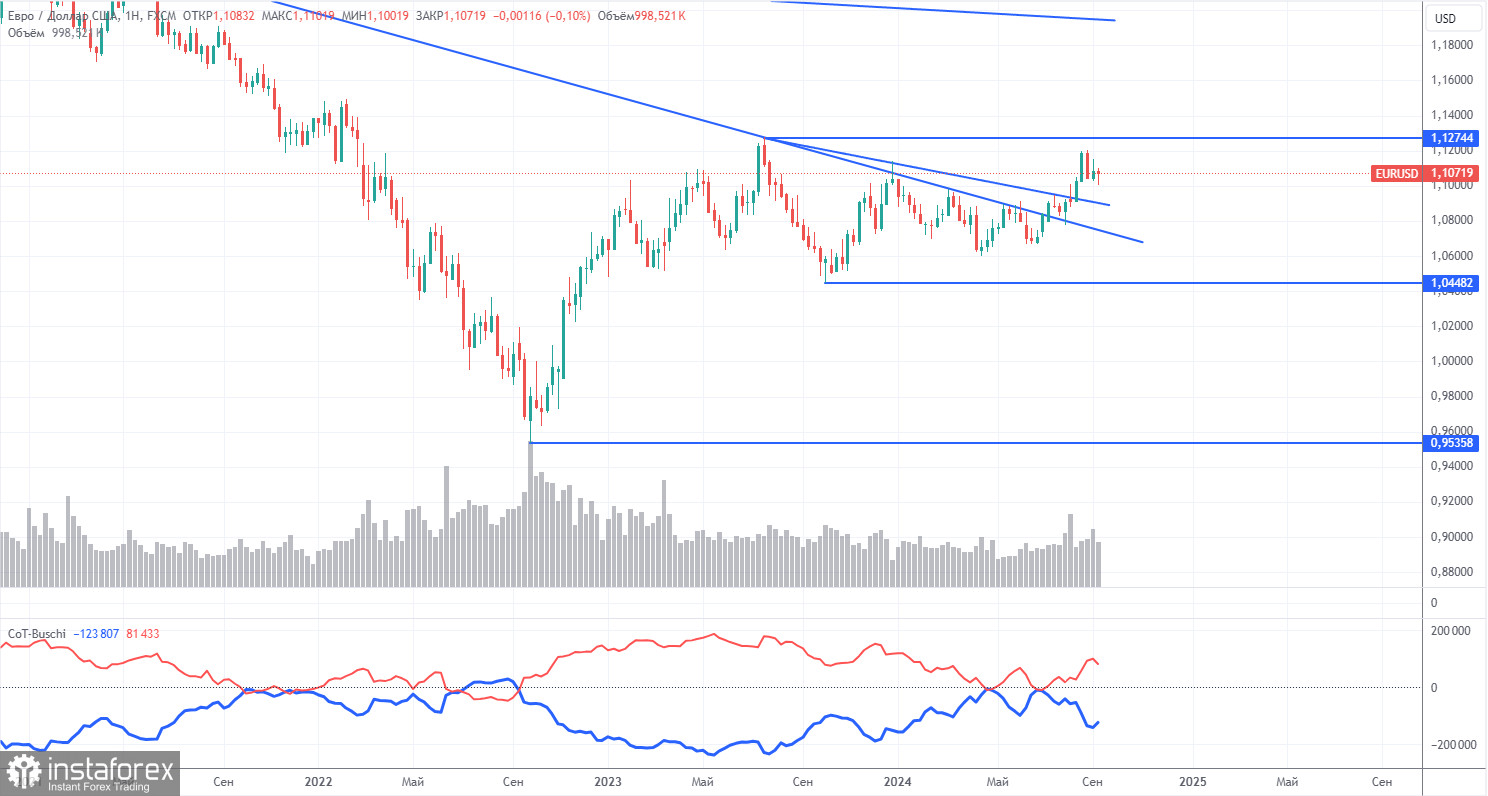
The latest COT report is dated September 10. The illustration above clearly shows that the net position of non-commercial traders has remained bullish for a long time. The bears' attempt to take over failed miserably. The net position of non-commercial traders (red line) declined in the second half of 2023 and early 2024, while commercial traders (blue line) increased. Currently, professional players are again increasing their long positions.
We also still do not see any fundamental factors supporting the strengthening of the euro. Technical analysis indicates that the price is in a consolidation phase—in other words, a flat. In the weekly time frame, it is clear that since December 2022, the pair has been trading between levels 1.0448 and 1.1274. In other words, we have moved from a seven-month flat into an 18-month one.
The red and blue lines are diverging at the moment, indicating that long positions on the euro are increasing. However, such changes cannot be a basis for long-term conclusions within a flat trend. During the last reporting week, the number of long positions in the non-commercial group decreased by 23,100, while the number of short positions fell by 4,500. Accordingly, the net position decreased by 18,600. Nevertheless, the euro still has the potential to fall.
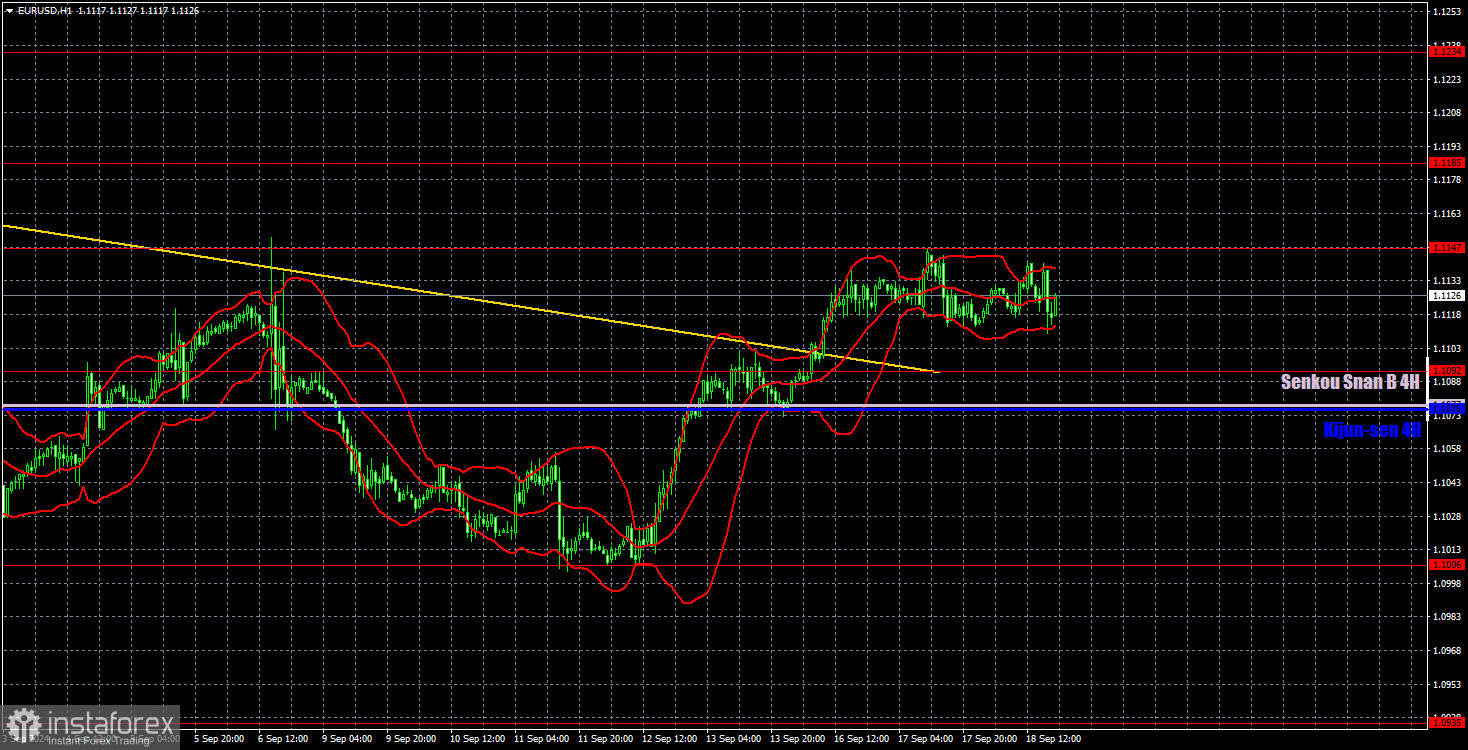
In the hourly time frame, the pair has a real chance to end its baseless upward trend, but these chances gradually fade. The trend line has been broken along with the Senkou Span B line. Now, the more global upward trend is likely to resume. There's no point in discussing the fundamental and macroeconomic reasons for a new decline in the dollar — they don't exist. To be more precise, the market only "sees" the news that tells it to sell the dollar.
For September 19, we highlight the following levels: 1.0658-1.0669, 1.0757, 1.0797, 1.0843, 1.0889, 1.0935, 1.1006, 1.1092, 1.1147, 1.1185, 1.1234, 1.1274, as well as the Senkou Span B line (1.1077) and the Kijun-sen line (1.1075). The Ichimoku indicator lines can move during the day, so this should be considered when identifying trading signals. Remember to set a Stop Loss to break even if the price has moved in the intended direction by 15 pips. This will protect you against potential losses if the signal turns out to be false.
On Thursday, no notable events are scheduled in the Eurozone, and in the US, only secondary unemployment claims data will be released. We believe that market participants will be under the influence of the FOMC meeting for most of the day, so volatile movements are possible throughout the day. The Bank of England meeting could also trigger movements in the EUR/USD pair.
Support and resistance levels: Thick red lines near which the trend may end. They are not sources of trading signals.
Kijun-sen and Senkou Span B lines: These Ichimoku indicator lines, transferred from the 4-hour timeframe to the hourly chart, are strong lines.
Extreme levels: Thin red lines from which the price previously bounced. These provide trading signals.
Yellow lines: Trend lines, trend channels, and other technical patterns.
Indicator 1 on COT charts: The net position size for each category of traders.
You have already liked this post today
*تعینات کیا مراد ہے مارکیٹ کے تجزیات یہاں ارسال کیے جاتے ہیں جس کا مقصد آپ کی بیداری بڑھانا ہے، لیکن تجارت کرنے کے لئے ہدایات دینا نہیں.


