یہ بھی دیکھیں


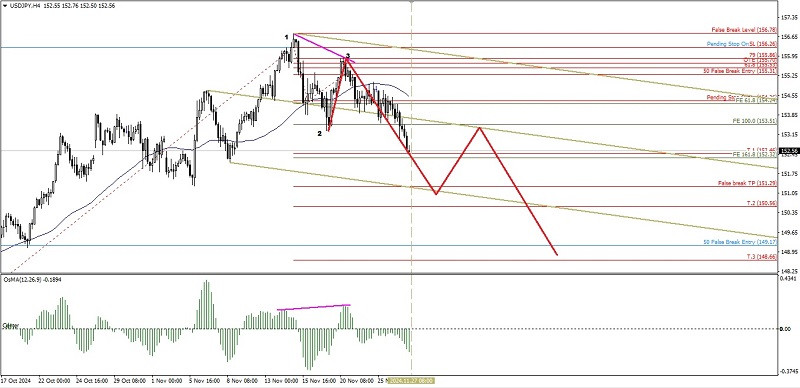
If we look at the 4-hour chart of the main USD/JPY currency pair, there are several interesting things, namely, its price movement moves harmoniously within the Bearish Pitchfork channel, it is also below the MA (50) whose slope slopes downwards, besides that, a Bearish 123 pattern also appears, followed by a hidden deviation between the MACD Histogram indicator and the USD/JPY price movement, so based on these facts, it can be concluded that USD/JPY is in a weakening condition so that in the near future level 152.32 will be tested if it is successfully broken and closes below it, then USD/JPY will continue to weaken to level 151.29 and/or Lower Line Bearish Pitchfork if momentum and volatility support it, then 149.17 could be the next target to be targeted, but all these weakening scenarios will be invalid and canceled by themselves if suddenly USD/JPY strengthens again to break and close above level 155.19.
(Disclaimer)
You have already liked this post today
*تعینات کیا مراد ہے مارکیٹ کے تجزیات یہاں ارسال کیے جاتے ہیں جس کا مقصد آپ کی بیداری بڑھانا ہے، لیکن تجارت کرنے کے لئے ہدایات دینا نہیں.


