

Actual patterns

Patterns are graphical models which are formed in the chart by the price. According to one of the technical analysis postulates, history (price movement) repeats itself. It means that the price movements are often similar in the same situations which makes it possible to predict the further development of the situation with a high probability.
Relevant patterns by InstaTrade is an easy-to-use service which allows you to be aware of latest changes in the market and react to clues from the market in time. In our service you will always find the latest and most relevant patterns on any pair and any timeframe.
Bullish Rectangle
was formed on 26.03 at 14:44:13 (UTC+0)
signal strength 3 of 5
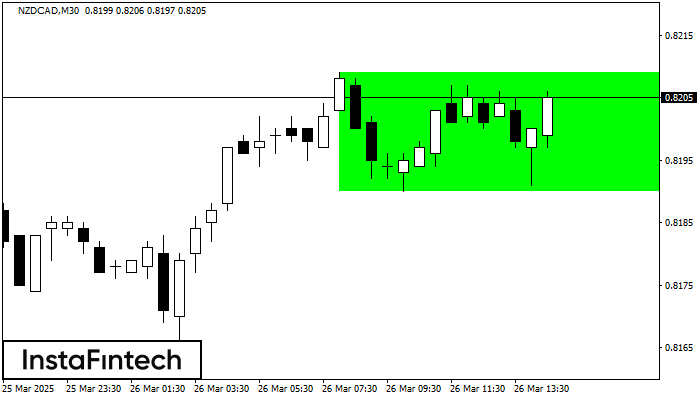
According to the chart of M30, NZDCAD formed the Bullish Rectangle which is a pattern of a trend continuation. The pattern is contained within the following borders: the lower border 0.8190 – 0.8190 and upper border 0.8209 – 0.8209. In case the upper border is broken, the instrument is likely to follow the upward trend.
See Also
- All
- All
- Bearish Rectangle
- Bearish Symmetrical Triangle
- Bearish Symmetrical Triangle
- Bullish Rectangle
- Double Top
- Double Top
- Triple Bottom
- Triple Bottom
- Triple Top
- Triple Top
- All
- All
- Buy
- Sale
- All
- 1
- 2
- 3
- 4
- 5
Bullish Symmetrical Triangle
was formed on 01.04 at 11:03:47 (UTC+0)
signal strength 3 of 5

According to the chart of M30, GBPUSD formed the Bullish Symmetrical Triangle pattern. The lower border of the pattern touches the coordinates 1.2876/1.2915 whereas the upper border goes across 1.2971/1.2915
Open chart in a new window
Bullish Symmetrical Triangle
was formed on 01.04 at 11:03:36 (UTC+0)
signal strength 4 of 5

According to the chart of H1, EURUSD formed the Bullish Symmetrical Triangle pattern, which signals the trend will continue. Description. The upper border of the pattern touches the coordinates 1.0849/1.0814
Open chart in a new window
Bullish Symmetrical Triangle
was formed on 01.04 at 10:36:33 (UTC+0)
signal strength 3 of 5

According to the chart of M30, EURUSD formed the Bullish Symmetrical Triangle pattern. Description: This is the pattern of a trend continuation. 1.0849 and 1.0777 are the coordinates
Open chart in a new window


