

Долзарб паттернлар

Тройная вершина
сформирован 27.03 в 15:00:06 (UTC+0)
сила сигнала 2 из 5
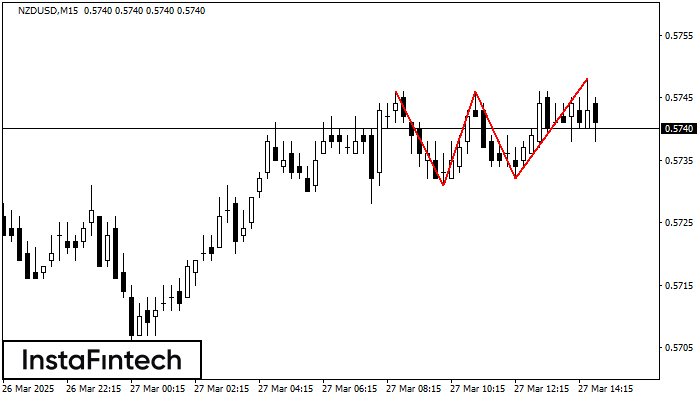
На графике NZDUSD M15 образовалась фигура «Тройная вершина», которая сигнализирует об изменении тенденции. Возможный сценарий: После формирования третьей вершины котировка постарается пробить нижнюю границу 0.5732, где трейдеру и стоило бы открывать торговую позицию на продажу. Тейк Профит - это и есть проекция ширины фигуры, которая составляет 14 пунктов.
Таймфреймы М5 и М15 могут иметь больше ложных точек входа.
- Все
- Все
- Bearish Rectangle
- Bearish Symmetrical Triangle
- Bearish Symmetrical Triangle
- Bullish Rectangle
- Double Top
- Double Top
- Triple Bottom
- Triple Bottom
- Triple Top
- Triple Top
- Все
- Все
- Покупка
- Продажа
- Все
- 1
- 2
- 3
- 4
- 5
Bullish Rectangle
was formed on 11.04 at 07:14:49 (UTC+0)
signal strength 1 of 5
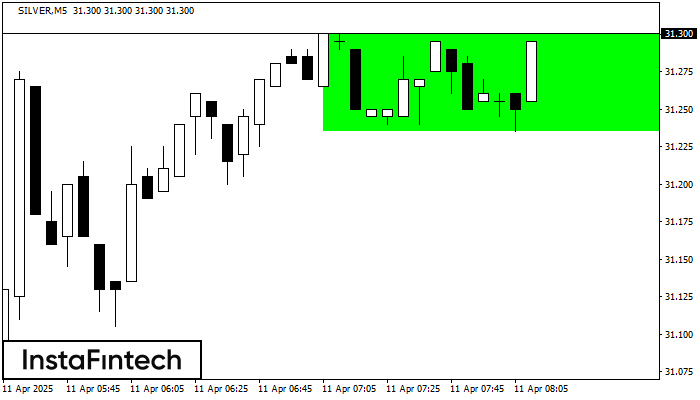
According to the chart of M5, SILVER formed the Bullish Rectangle. The pattern indicates a trend continuation. The upper border is 31.30, the lower border is 31.23. The signal means
The M5 and M15 time frames may have more false entry points.
Open chart in a new window
Head and Shoulders
was formed on 11.04 at 07:10:18 (UTC+0)
signal strength 1 of 5
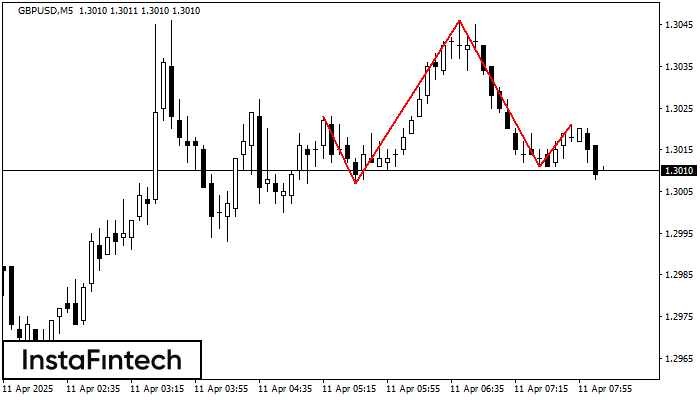
According to the chart of M5, GBPUSD formed the Head and Shoulders pattern. The Head’s top is set at 1.3046 while the median line of the Neck is found
The M5 and M15 time frames may have more false entry points.
Open chart in a new window
Triple Top
was formed on 11.04 at 07:01:17 (UTC+0)
signal strength 1 of 5
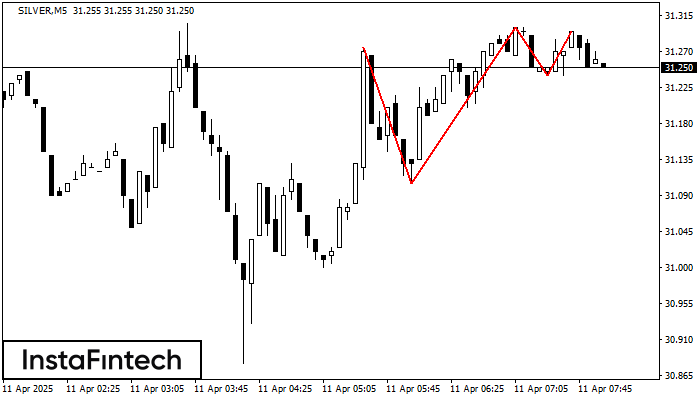
The Triple Top pattern has formed on the chart of the SILVER M5. Features of the pattern: borders have an ascending angle; the lower line of the pattern
The M5 and M15 time frames may have more false entry points.
Open chart in a new window


