

Долзарб паттернлар

Двойное дно
сформирован 20.03 в 21:20:16 (UTC+0)
сила сигнала 1 из 5
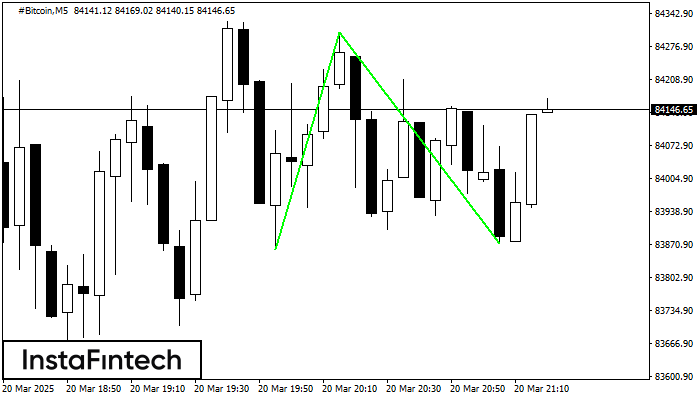
Сформирована фигура «Двойное дно» на графике #Bitcoin M5. Верхняя граница 84305.44; Нижняя граница 83872.78; Ширина фигуры 44613 пунктов. В случае пробоя верхней границы 84305.44 можно будет прогнозировать изменение тенденции, где ширина фигуры и будет являться расстоянием предположительного Тейк Профита.
Таймфреймы М5 и М15 могут иметь больше ложных точек входа.
- Все
- Все
- Bearish Rectangle
- Bearish Symmetrical Triangle
- Bearish Symmetrical Triangle
- Bullish Rectangle
- Double Top
- Double Top
- Triple Bottom
- Triple Bottom
- Triple Top
- Triple Top
- Все
- Все
- Покупка
- Продажа
- Все
- 1
- 2
- 3
- 4
- 5
Triple Top
was formed on 25.03 at 12:40:11 (UTC+0)
signal strength 1 of 5
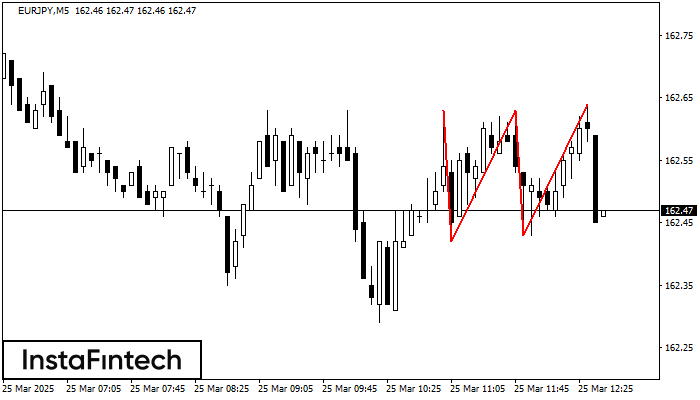
On the chart of the EURJPY M5 trading instrument, the Triple Top pattern that signals a trend change has formed. It is possible that after formation of the third peak
The M5 and M15 time frames may have more false entry points.
Open chart in a new window
Double Top
was formed on 25.03 at 12:00:12 (UTC+0)
signal strength 1 of 5
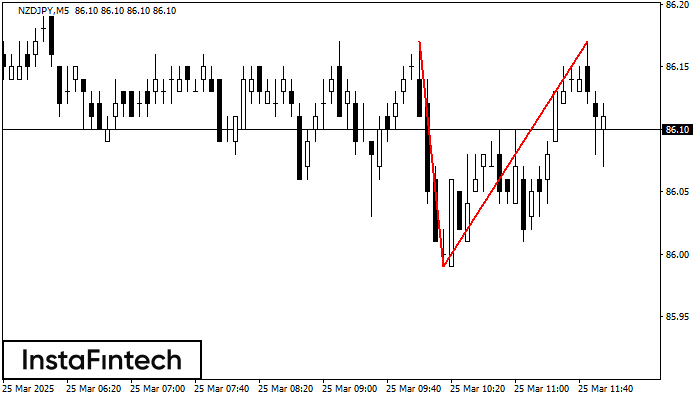
The Double Top reversal pattern has been formed on NZDJPY M5. Characteristics: the upper boundary 86.17; the lower boundary 85.99; the width of the pattern is 18 points. Sell trades
The M5 and M15 time frames may have more false entry points.
Open chart in a new window
Double Bottom
was formed on 25.03 at 12:00:11 (UTC+0)
signal strength 4 of 5
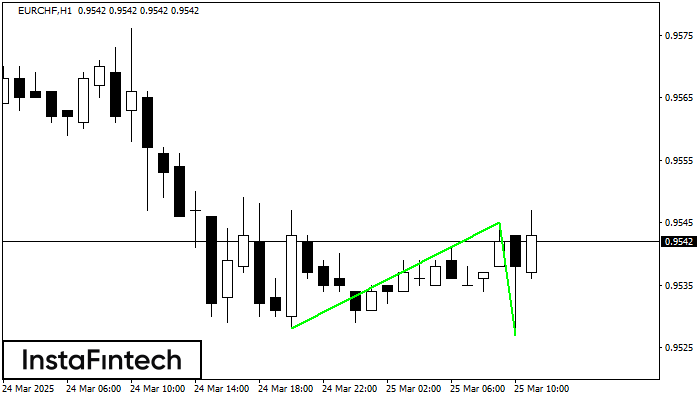
The Double Bottom pattern has been formed on EURCHF H1; the upper boundary is 0.9545; the lower boundary is 0.9527. The width of the pattern is 17 points. In case
Open chart in a new window


