

Corak sebenar

Triple Top
was formed on 30.03 at 11:20:04 (UTC+0)
signal strength 1 of 5

On the chart of the #Bitcoin M5 trading instrument, the Triple Top pattern that signals a trend change has formed. It is possible that after formation of the third peak, the price will try to break through the resistance level 82818.73, where we advise to open a trading position for sale. Take profit is the projection of the pattern’s width, which is 46117 points.
The M5 and M15 time frames may have more false entry points.
- All
- All
- Bearish Rectangle
- Bearish Symmetrical Triangle
- Bearish Symmetrical Triangle
- Bullish Rectangle
- Double Top
- Double Top
- Triple Bottom
- Triple Bottom
- Triple Top
- Triple Top
- All
- All
- Buy
- Sale
- All
- 1
- 2
- 3
- 4
- 5
Triple Top
was formed on 11.04 at 05:50:16 (UTC+0)
signal strength 1 of 5
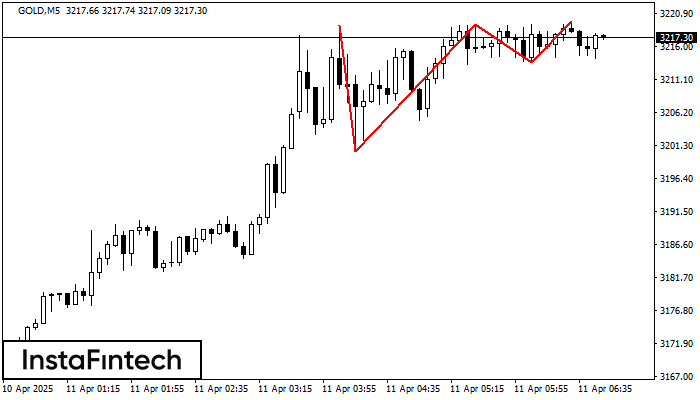
The Triple Top pattern has formed on the chart of the GOLD M5 trading instrument. It is a reversal pattern featuring the following characteristics: resistance level -62, support level -1317
The M5 and M15 time frames may have more false entry points.
Open chart in a new window
Double Bottom
was formed on 11.04 at 05:45:06 (UTC+0)
signal strength 2 of 5
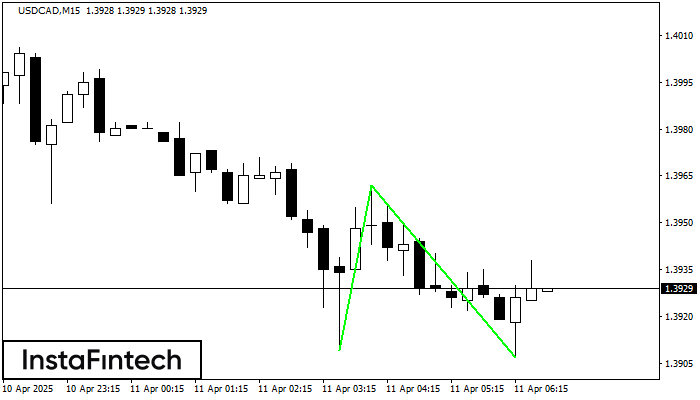
The Double Bottom pattern has been formed on USDCAD M15. This formation signals a reversal of the trend from downwards to upwards. The signal is that a buy trade should
The M5 and M15 time frames may have more false entry points.
Open chart in a new window
Double Top
was formed on 11.04 at 04:00:34 (UTC+0)
signal strength 4 of 5
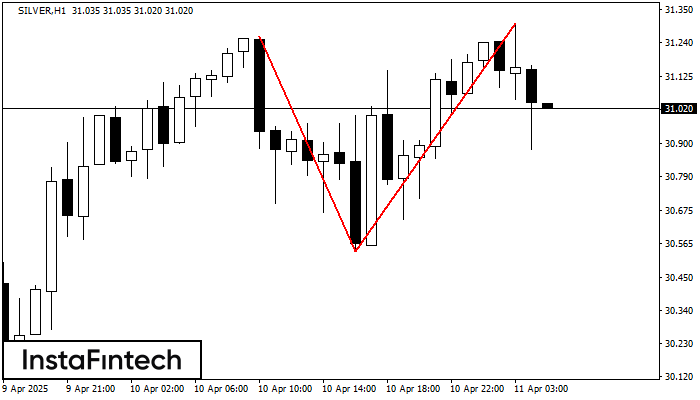
The Double Top reversal pattern has been formed on SILVER H1. Characteristics: the upper boundary 31.26; the lower boundary 30.54; the width of the pattern is 765 points. Sell trades
Open chart in a new window


