

Corak sebenar

Bullish pennant
was formed on 28.03 at 01:55:41 (UTC+0)
signal strength 1 of 5
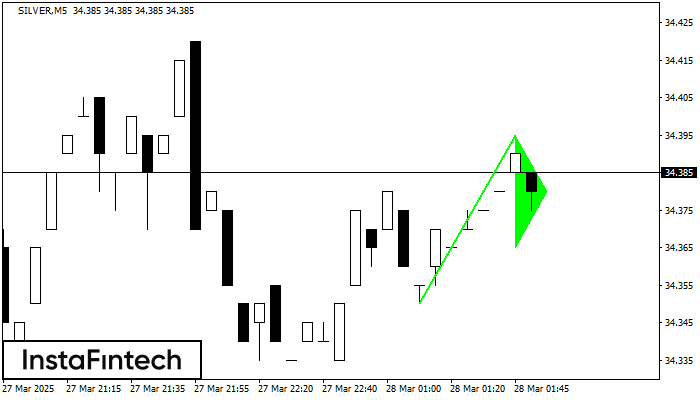
The Bullish pennant pattern is formed on the SILVER M5 chart. It is a type of the continuation pattern. Supposedly, in case the price is fixed above the pennant’s high of 34.40, a further uptrend is possible.
The M5 and M15 time frames may have more false entry points.
Juga lihat
- All
- All
- Bearish Rectangle
- Bearish Symmetrical Triangle
- Bearish Symmetrical Triangle
- Bullish Rectangle
- Double Top
- Double Top
- Triple Bottom
- Triple Bottom
- Triple Top
- Triple Top
- All
- All
- Buy
- Sale
- All
- 1
- 2
- 3
- 4
- 5
Double Bottom
was formed on 02.04 at 10:40:27 (UTC+0)
signal strength 1 of 5
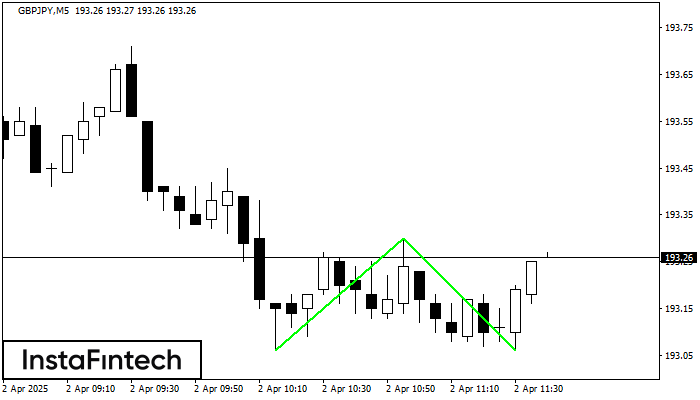
The Double Bottom pattern has been formed on GBPJPY M5; the upper boundary is 193.30; the lower boundary is 193.06. The width of the pattern is 24 points. In case
The M5 and M15 time frames may have more false entry points.
Open chart in a new window
Bullish Symmetrical Triangle
was formed on 02.04 at 10:35:34 (UTC+0)
signal strength 1 of 5
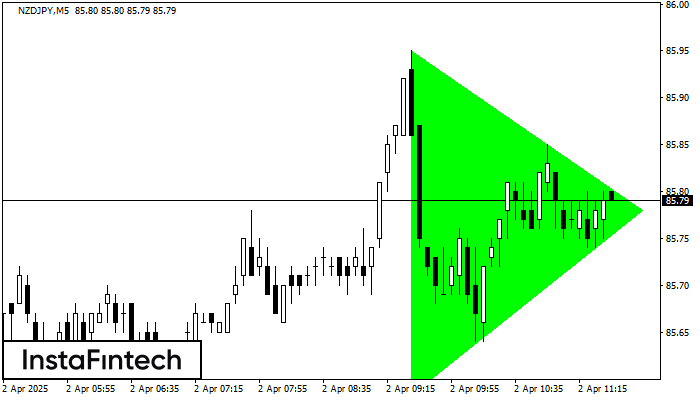
According to the chart of M5, NZDJPY formed the Bullish Symmetrical Triangle pattern, which signals the trend will continue. Description. The upper border of the pattern touches the coordinates 85.95/85.78
The M5 and M15 time frames may have more false entry points.
Open chart in a new window
Double Bottom
was formed on 02.04 at 10:30:25 (UTC+0)
signal strength 3 of 5
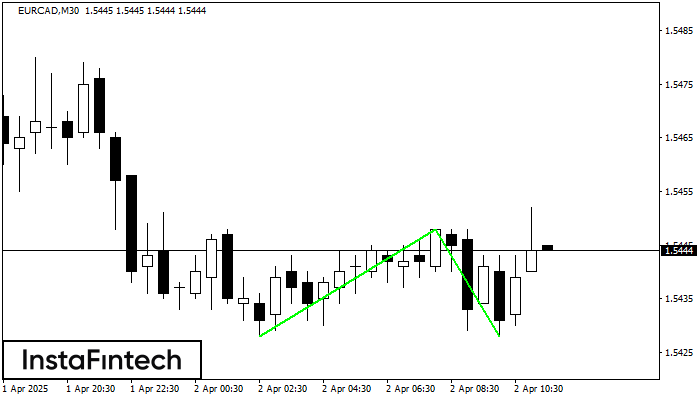
The Double Bottom pattern has been formed on EURCAD M30. Characteristics: the support level 1.5428; the resistance level 1.5448; the width of the pattern 20 points. If the resistance level
Open chart in a new window


