

Corak sebenar

Bullish Rectangle
was formed on 27.03 at 20:14:53 (UTC+0)
signal strength 1 of 5
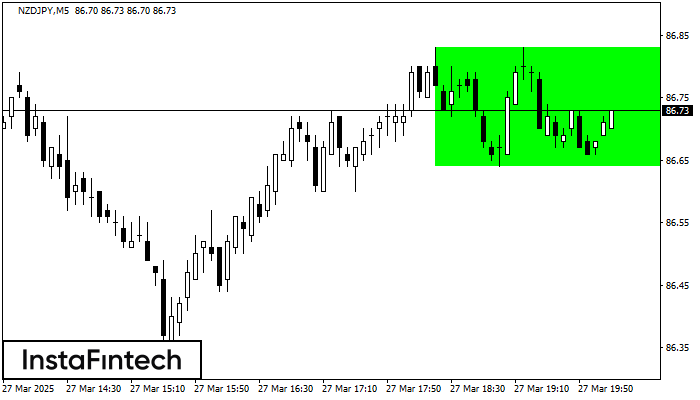
According to the chart of M5, NZDJPY formed the Bullish Rectangle. This type of a pattern indicates a trend continuation. It consists of two levels: resistance 86.83 and support 86.64. In case the resistance level 86.83 - 86.83 is broken, the instrument is likely to follow the bullish trend.
The M5 and M15 time frames may have more false entry points.
Juga lihat
- All
- All
- Bearish Rectangle
- Bearish Symmetrical Triangle
- Bearish Symmetrical Triangle
- Bullish Rectangle
- Double Top
- Double Top
- Triple Bottom
- Triple Bottom
- Triple Top
- Triple Top
- All
- All
- Buy
- Sale
- All
- 1
- 2
- 3
- 4
- 5
Bullish Symmetrical Triangle
was formed on 17.04 at 23:36:52 (UTC+0)
signal strength 1 of 5

According to the chart of M5, EURJPY formed the Bullish Symmetrical Triangle pattern. Description: This is the pattern of a trend continuation. 161.95 and 161.75 are the coordinates
The M5 and M15 time frames may have more false entry points.
Open chart in a new window
Bearish Symmetrical Triangle
was formed on 17.04 at 23:30:07 (UTC+0)
signal strength 1 of 5

According to the chart of M5, USDCHF formed the Bearish Symmetrical Triangle pattern. Description: The lower border is 0.8182/0.8188 and upper border is 0.8195/0.8188. The pattern width is measured
The M5 and M15 time frames may have more false entry points.
Open chart in a new window
Bearish Rectangle
was formed on 17.04 at 23:30:00 (UTC+0)
signal strength 1 of 5
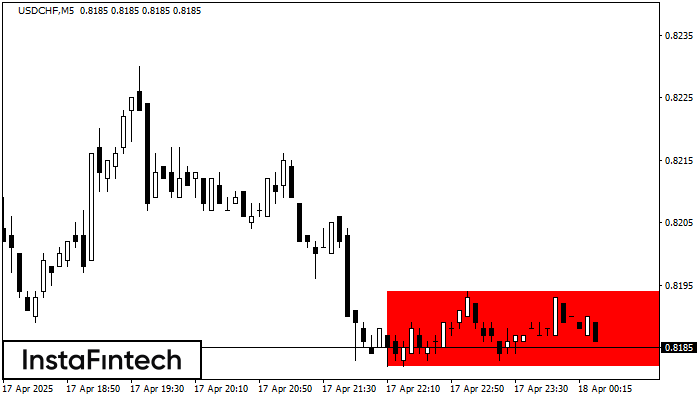
According to the chart of M5, USDCHF formed the Bearish Rectangle. The pattern indicates a trend continuation. The upper border is 0.8194, the lower border is 0.8182. The signal means
The M5 and M15 time frames may have more false entry points.
Open chart in a new window


