

Corak sebenar

Bullish Rectangle
was formed on 27.03 at 17:02:05 (UTC+0)
signal strength 1 of 5
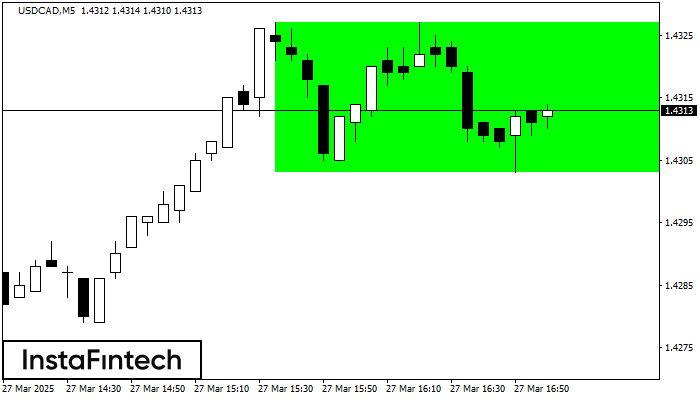
According to the chart of M5, USDCAD formed the Bullish Rectangle. The pattern indicates a trend continuation. The upper border is 1.4327, the lower border is 1.4303. The signal means that a long position should be opened above the upper border 1.4327 of the Bullish Rectangle.
The M5 and M15 time frames may have more false entry points.
Juga lihat
- All
- All
- Bearish Rectangle
- Bearish Symmetrical Triangle
- Bearish Symmetrical Triangle
- Bullish Rectangle
- Double Top
- Double Top
- Triple Bottom
- Triple Bottom
- Triple Top
- Triple Top
- All
- All
- Buy
- Sale
- All
- 1
- 2
- 3
- 4
- 5
Double Bottom
was formed on 02.04 at 11:20:53 (UTC+0)
signal strength 1 of 5

Corak Double Bottom telah dibentuk pada EURNZD M5. Ciri-ciri: tahap sokongan 1.8799; tahap rintangan 1.8817; lebar corak 18 mata. Sekiranya tahap rintangan ditembusi, perubahan aliran boleh diramalkan dengan titik sasaran
Carta masa M5 dan M15 mungkin mempunyai lebih banyak titik kemasukan palsu.
Open chart in a new window
Inverse Head dan Shoulder
was formed on 02.04 at 11:00:29 (UTC+0)
signal strength 4 of 5
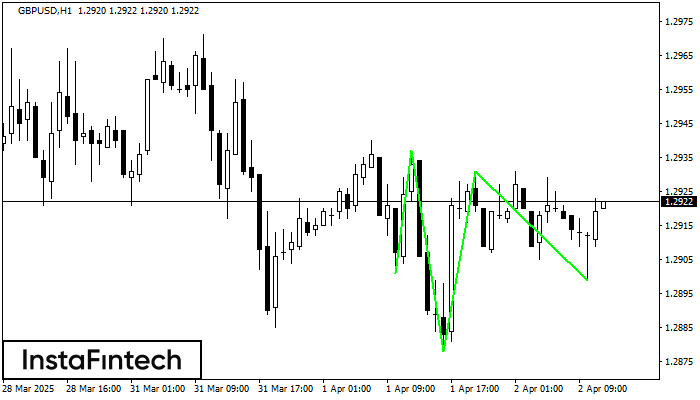
According to H1, GBPUSD is shaping the technical pattern – the Inverse Head dan Shoulder. In case the Neckline 1.2937/1.2931 is broken out, the instrument is likely to move toward
Open chart in a new window
Double Bottom
was formed on 02.04 at 11:00:06 (UTC+0)
signal strength 4 of 5
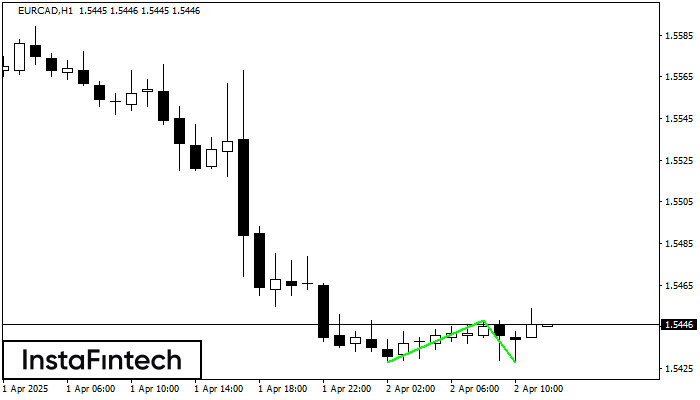
Corak Double Bottom telah dibentuk pada EURCAD H1; sempadan atas adalah 1.5448; sempadan bawah adalah 1.5428. Lebar corak adalah 20 mata. Sekiranya penembusan sempadan atas 1.5448, perubahan aliran boleh diramalkan
Open chart in a new window


